Fig. 6.
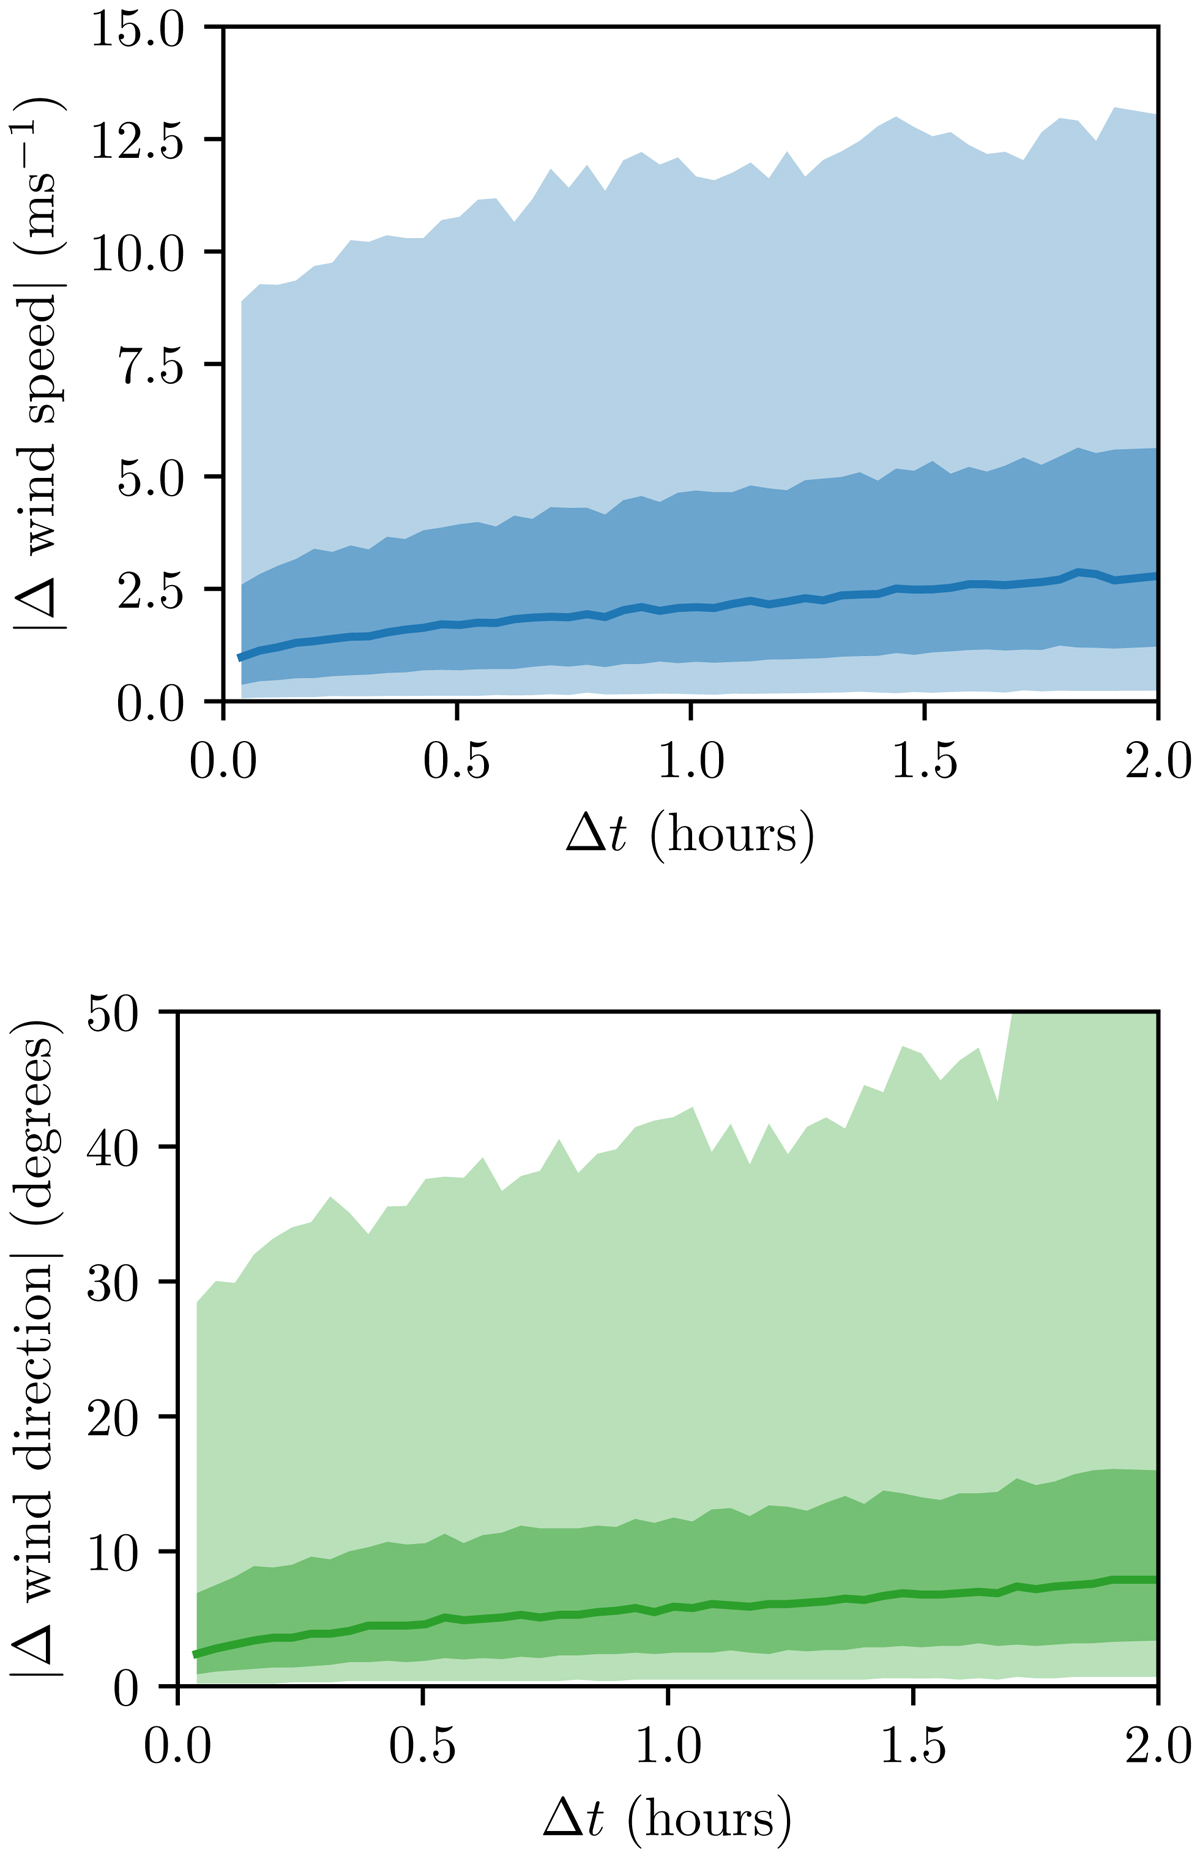
Typical temporal evolution of the wind speed (top) and wind direction (bottom) within the 8−12 km altitude region, extracted from the 2018 Stereo-SCIDAR campaign at Paranal observatory. In every panel, the lighter shaded region contains 90% of the data, the darker shaded region contains 50%, and the solid line is the median.
Current usage metrics show cumulative count of Article Views (full-text article views including HTML views, PDF and ePub downloads, according to the available data) and Abstracts Views on Vision4Press platform.
Data correspond to usage on the plateform after 2015. The current usage metrics is available 48-96 hours after online publication and is updated daily on week days.
Initial download of the metrics may take a while.