Fig. 4.
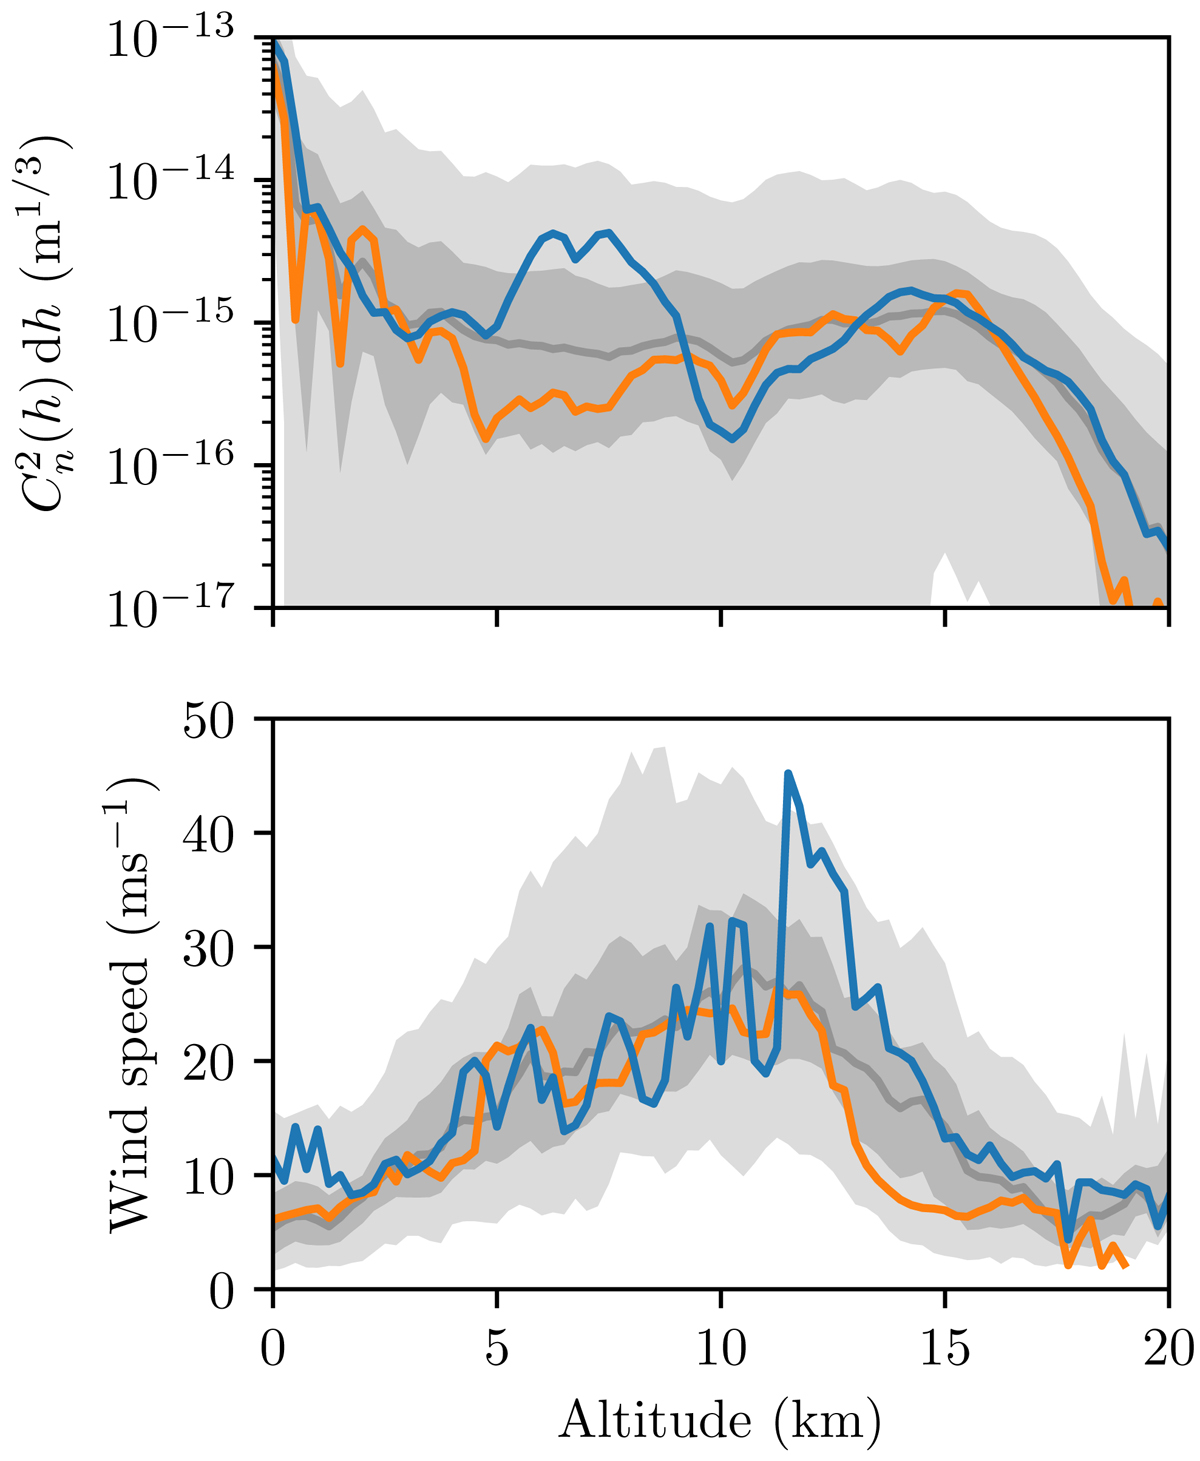
Turbulence strength and wind speed profiles with altitude measured at Paranal observatory during the 2018 Stereo-SCIDAR campaign. In both figures, the lighter shaded region contains 90% of the data, the darker shaded region contains 50%, and the solid line is the median. Top: integrated refractive index structure constant between two altitude limits, ![]() , as a function of the altitude h. Bottom: wind speed as a function of the altitude h. The blue solid line corresponds to the median in winter (May to October) and the orange solid line to the median in summer (November to April).
, as a function of the altitude h. Bottom: wind speed as a function of the altitude h. The blue solid line corresponds to the median in winter (May to October) and the orange solid line to the median in summer (November to April).
Current usage metrics show cumulative count of Article Views (full-text article views including HTML views, PDF and ePub downloads, according to the available data) and Abstracts Views on Vision4Press platform.
Data correspond to usage on the plateform after 2015. The current usage metrics is available 48-96 hours after online publication and is updated daily on week days.
Initial download of the metrics may take a while.