Fig. B.1.
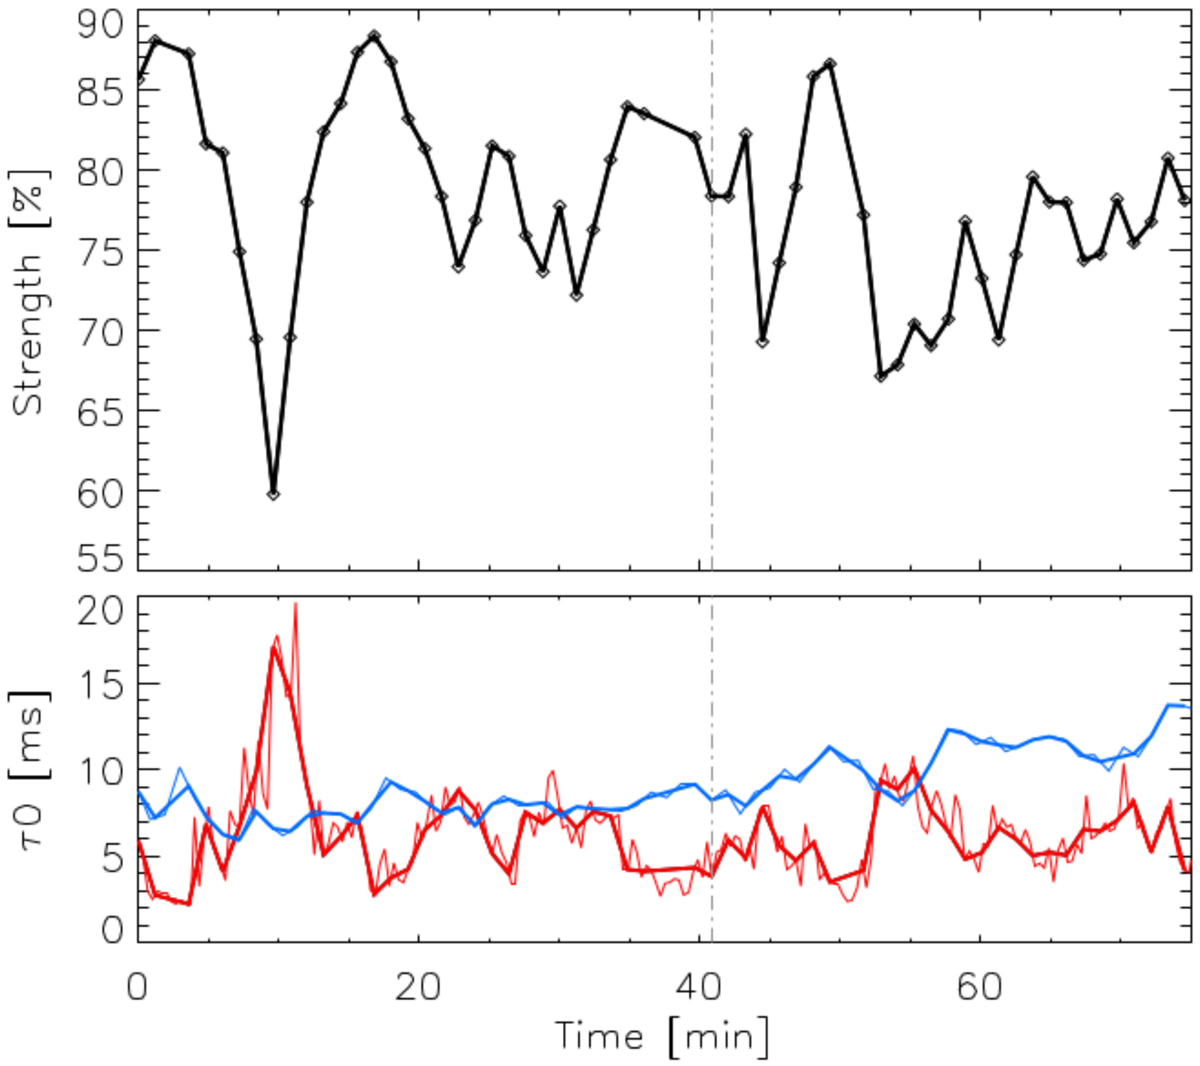
Upper panel: strength of the WDH as a function of time extracted from the 51 Eri data taken with SPHERE (at 1 μm) on September 25, 2015, starting at 8h19m40s and ending at 9h35m25s (UTC). Lower panel: measured turbulence coherence time τ0 as a function of time during the 51 Eri observation sequence. The AO-telemetry data are from SPHERE-SPARTA (red solid lines) and the atmospheric profiling data are from the MASS–DIMM (blue solid lines). In both cases, the full data are shown by the thin line, and the thick line shows the data interpolated at the image rate (black diamonds in the upper panel). In both panels, the meridian crossing of the target star is indicated by the gray dot-dashed line.
Current usage metrics show cumulative count of Article Views (full-text article views including HTML views, PDF and ePub downloads, according to the available data) and Abstracts Views on Vision4Press platform.
Data correspond to usage on the plateform after 2015. The current usage metrics is available 48-96 hours after online publication and is updated daily on week days.
Initial download of the metrics may take a while.