Fig. 16.
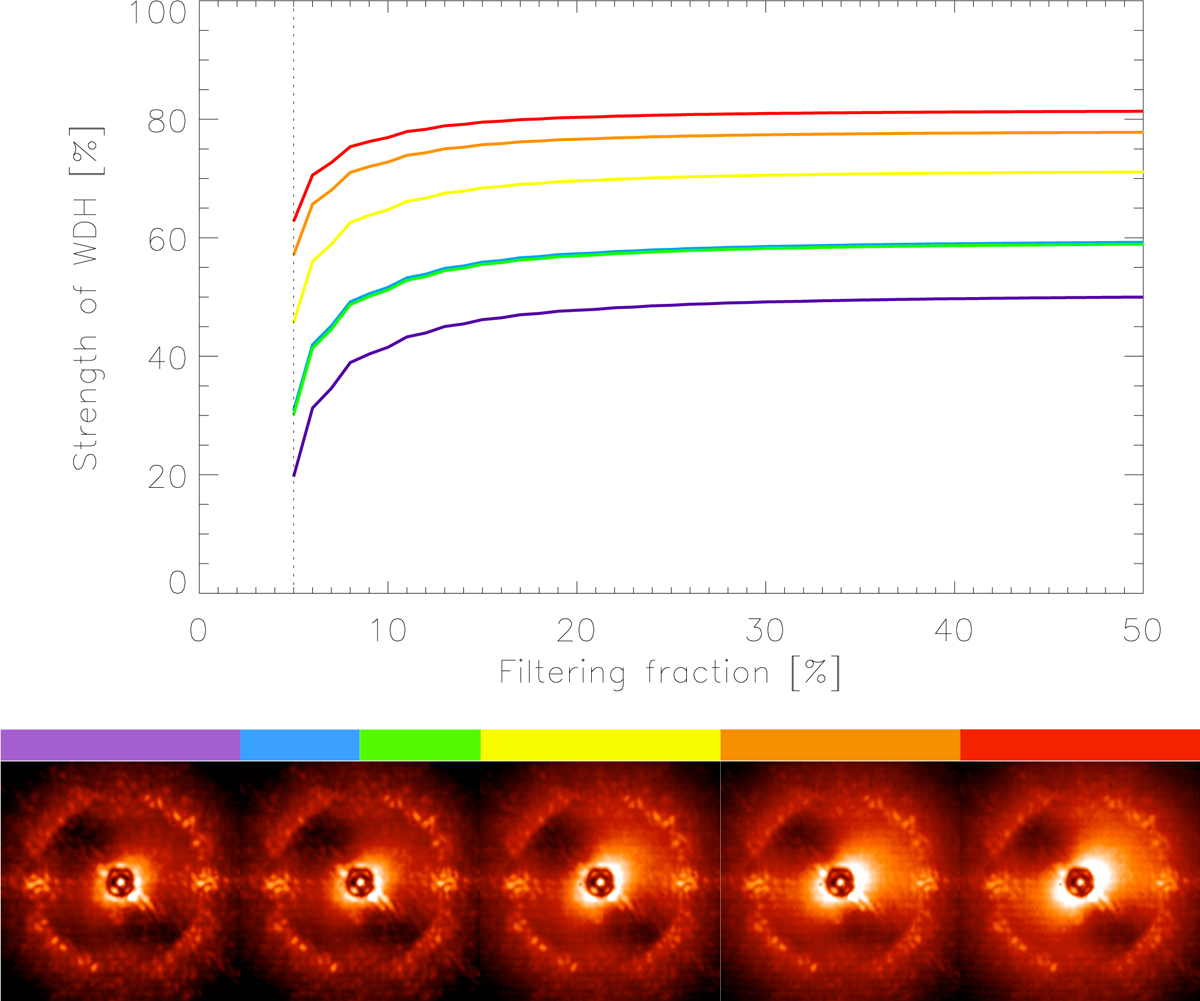
Evaluation of the strength of the WDH. Top: strength of the WDH contribution in the AO-corrected area of the focal-plane image 𝒮WDH, defined in Eq. (4), as a function of the filtering fraction (starting at 5%, black dotted line). Bottom: corresponding images from the 51 Eri data set showing low WDH residuals (left), and average (middle) to high (right) WDH. The images corresponding to the green and blue lines look very similar, therefore we only show one here.
Current usage metrics show cumulative count of Article Views (full-text article views including HTML views, PDF and ePub downloads, according to the available data) and Abstracts Views on Vision4Press platform.
Data correspond to usage on the plateform after 2015. The current usage metrics is available 48-96 hours after online publication and is updated daily on week days.
Initial download of the metrics may take a while.