Fig. 14.
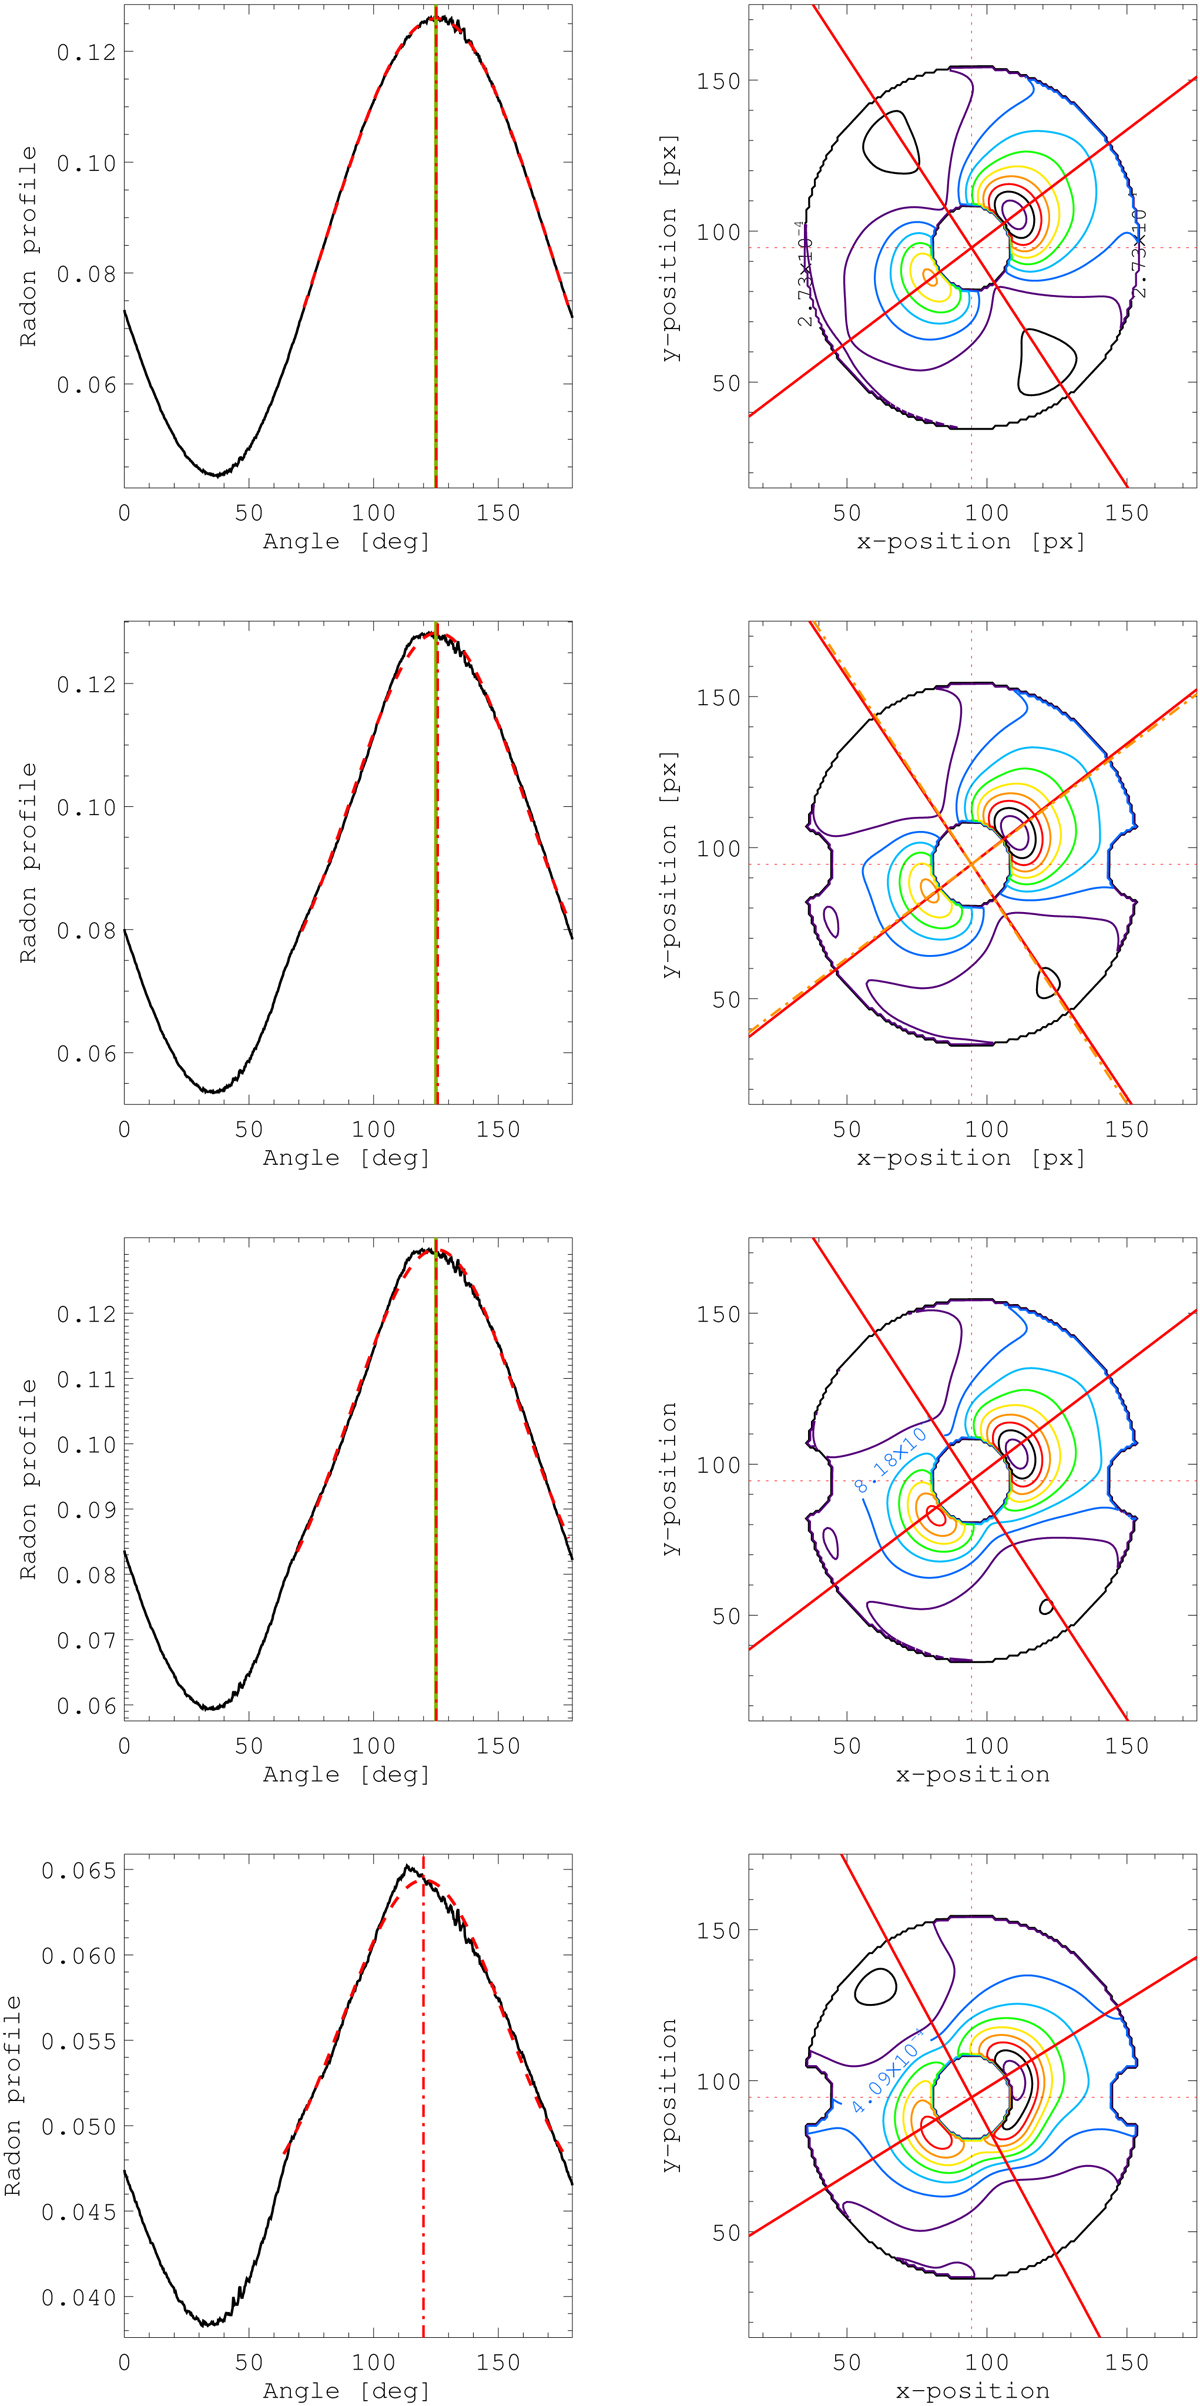
Estimate the wind direction for the four cases: extracted radon profile of the WDH and Gaussian fit (red dashed line) whose maximum (red dot-dashed line) shows the estimated preferential direction (left), and contour plot of the WDH showing the fitted wind direction (red cross) with the described procedure (right). From top to bottom: Case 1 (from AO simulations including only the fitting and servolag errors), case 2 (adding NCPA), case 3 (adding LOR and LWE), and case 4 (51 Eri on-sky data). Except for case 1, a filtering fraction of 15% has been used to isolate the WDH. For the first three cases we simulated, the green line shows the simulated wind direction (125 degrees).
Current usage metrics show cumulative count of Article Views (full-text article views including HTML views, PDF and ePub downloads, according to the available data) and Abstracts Views on Vision4Press platform.
Data correspond to usage on the plateform after 2015. The current usage metrics is available 48-96 hours after online publication and is updated daily on week days.
Initial download of the metrics may take a while.