Fig. 13.
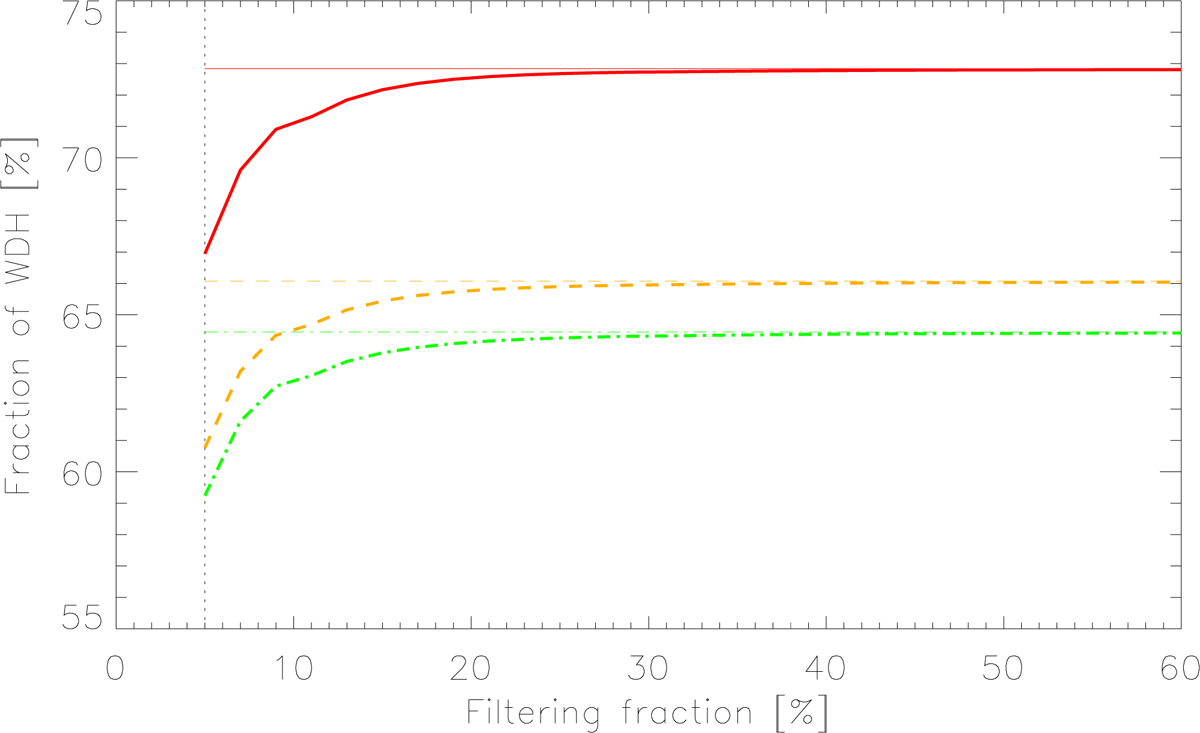
Amount of light within the WDH structure that is extracted by spatial filtering as a function of the filtering fraction (starting from 5% at the vertical dotted black line). The red solid line is the first case containing only the WDH contribution, the orange dashed line is the second case with NCPA, and the green dot-dashed line is the third case containing NCPA, LWE, and LOR. The horizontal lines, with the same color code, are the real theoretical values extracted by simulating the exact same images, but without the servolag error ( 73%, 66%, and 64%, respectively).
Current usage metrics show cumulative count of Article Views (full-text article views including HTML views, PDF and ePub downloads, according to the available data) and Abstracts Views on Vision4Press platform.
Data correspond to usage on the plateform after 2015. The current usage metrics is available 48-96 hours after online publication and is updated daily on week days.
Initial download of the metrics may take a while.