Fig. 12.
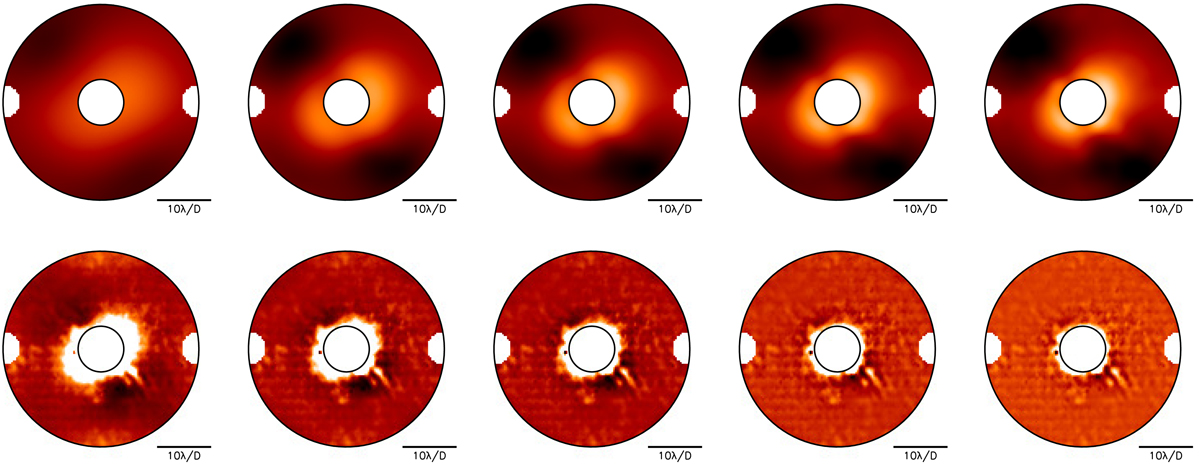
Spatially low-pass filtered images of the 51 Eri image shown in Fig. 11 right (top, logarithmic scale) and difference between the image and its low-pass filtered version (bottom, linear scale). The images are masked to show only the AO-corrected area and hide the DM artifacts and the coronagraphic signature. From left to right with a filtering fraction (percentage of low frequencies kept in the image) of 5%, 10%, 15%, 20%, and 25%.
Current usage metrics show cumulative count of Article Views (full-text article views including HTML views, PDF and ePub downloads, according to the available data) and Abstracts Views on Vision4Press platform.
Data correspond to usage on the plateform after 2015. The current usage metrics is available 48-96 hours after online publication and is updated daily on week days.
Initial download of the metrics may take a while.