Fig. 11.
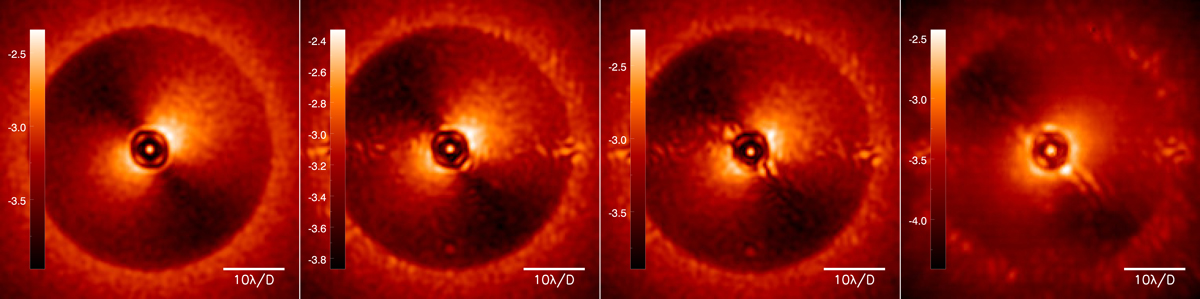
High-contrast images (at the shortest wavelength, 0.966 μm) used to verify the WDH analysis procedure (logarithmic scale). Left: simulation using only the fitting and AO-servolag errors. Middle left: simulation additionally including NCPA upstream (given by the ZELDA on-sky estimate) and downstream of the APLC focal-plane mask. Middle right: simulation additionally including LOR and LWE. Right: on-sky image of the star 51 Eri taken with the VLT/SPHERE-IFS instrument.
Current usage metrics show cumulative count of Article Views (full-text article views including HTML views, PDF and ePub downloads, according to the available data) and Abstracts Views on Vision4Press platform.
Data correspond to usage on the plateform after 2015. The current usage metrics is available 48-96 hours after online publication and is updated daily on week days.
Initial download of the metrics may take a while.