Fig. 10.
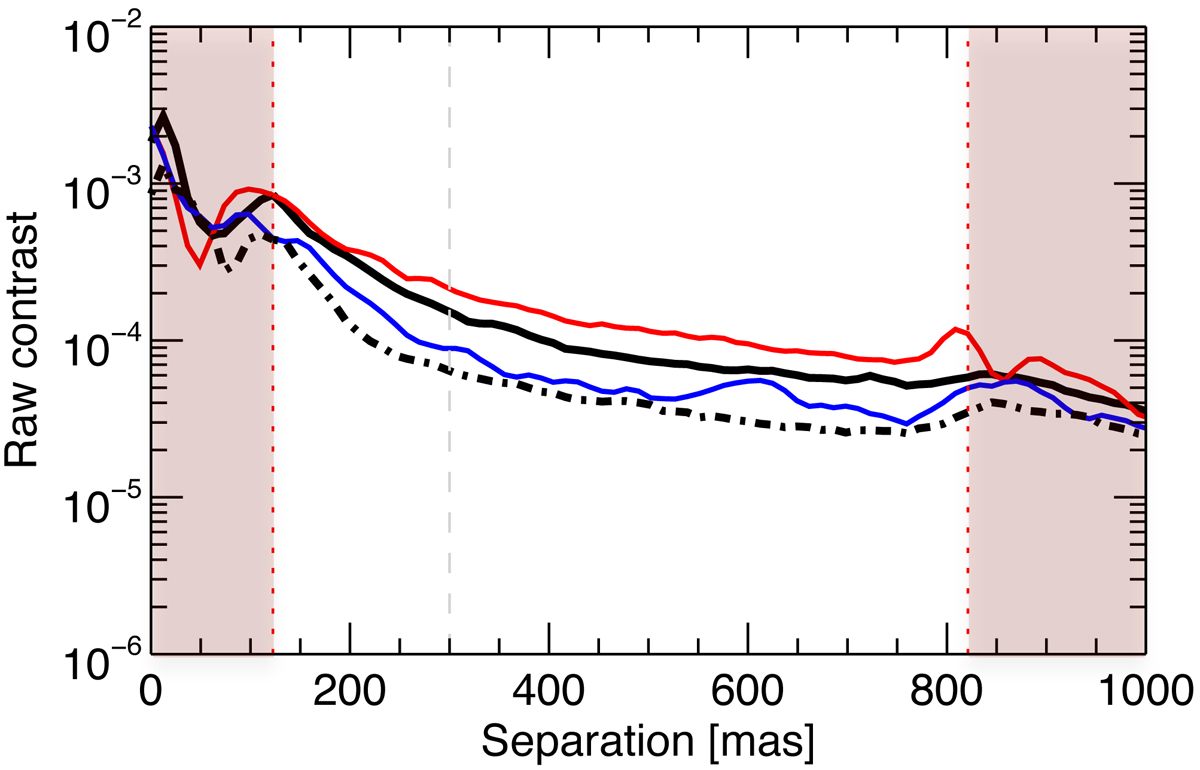
Raw contrast as a function of the separation to the star for the two images with (solid lines) and without (dot-dashed line) WDH presented in Fig. 9. The red line shows this along the WDH, the blue line in the perpendicular direction, and the black lines are the azimuthal median. The two red shaded areas correspond to the region that is affected by the coronagraph (left) and the region outside the AO correction zone (right).
Current usage metrics show cumulative count of Article Views (full-text article views including HTML views, PDF and ePub downloads, according to the available data) and Abstracts Views on Vision4Press platform.
Data correspond to usage on the plateform after 2015. The current usage metrics is available 48-96 hours after online publication and is updated daily on week days.
Initial download of the metrics may take a while.