Fig. 1.
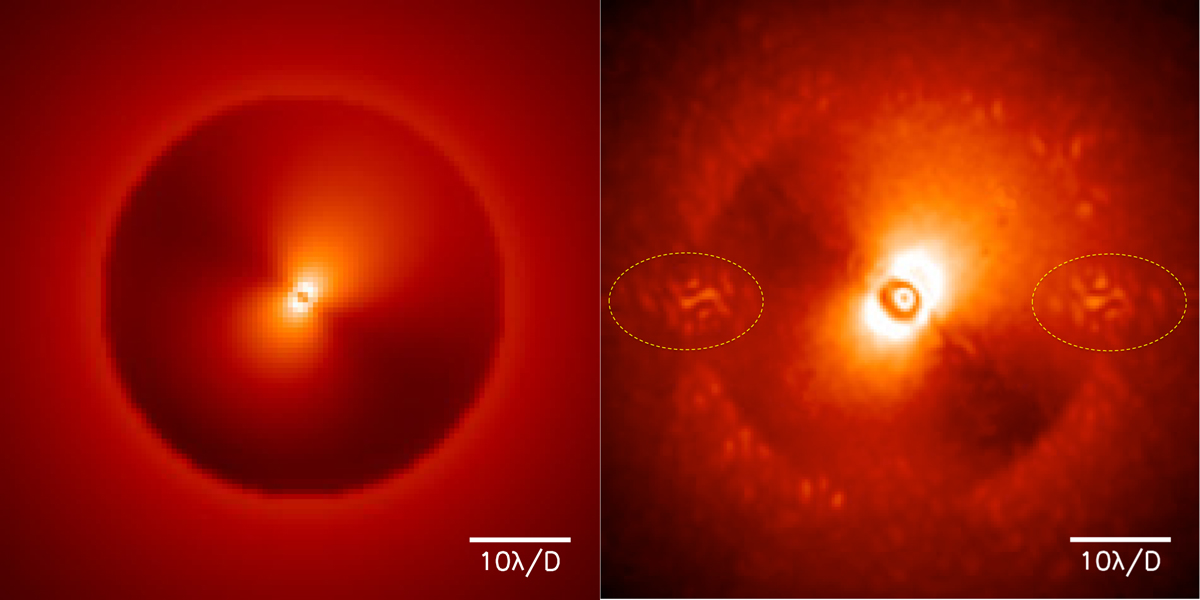
Coronagraphic focal plane images showing the wind-driven halo. Left: simulation of a perfect post-AO coronagraphic image of infinite exposure using an analytic AO tool (accounting only for fitting and servolag errors). Right: one exposure obtained with SPHERE-IRDIS (H2 band). Both images are in logarithmic scale to emphasize the WDH. The two regions encircled with yellow dotted lines are artifacts caused by the manufacturing technique of the DM.
Current usage metrics show cumulative count of Article Views (full-text article views including HTML views, PDF and ePub downloads, according to the available data) and Abstracts Views on Vision4Press platform.
Data correspond to usage on the plateform after 2015. The current usage metrics is available 48-96 hours after online publication and is updated daily on week days.
Initial download of the metrics may take a while.