Fig. 3.
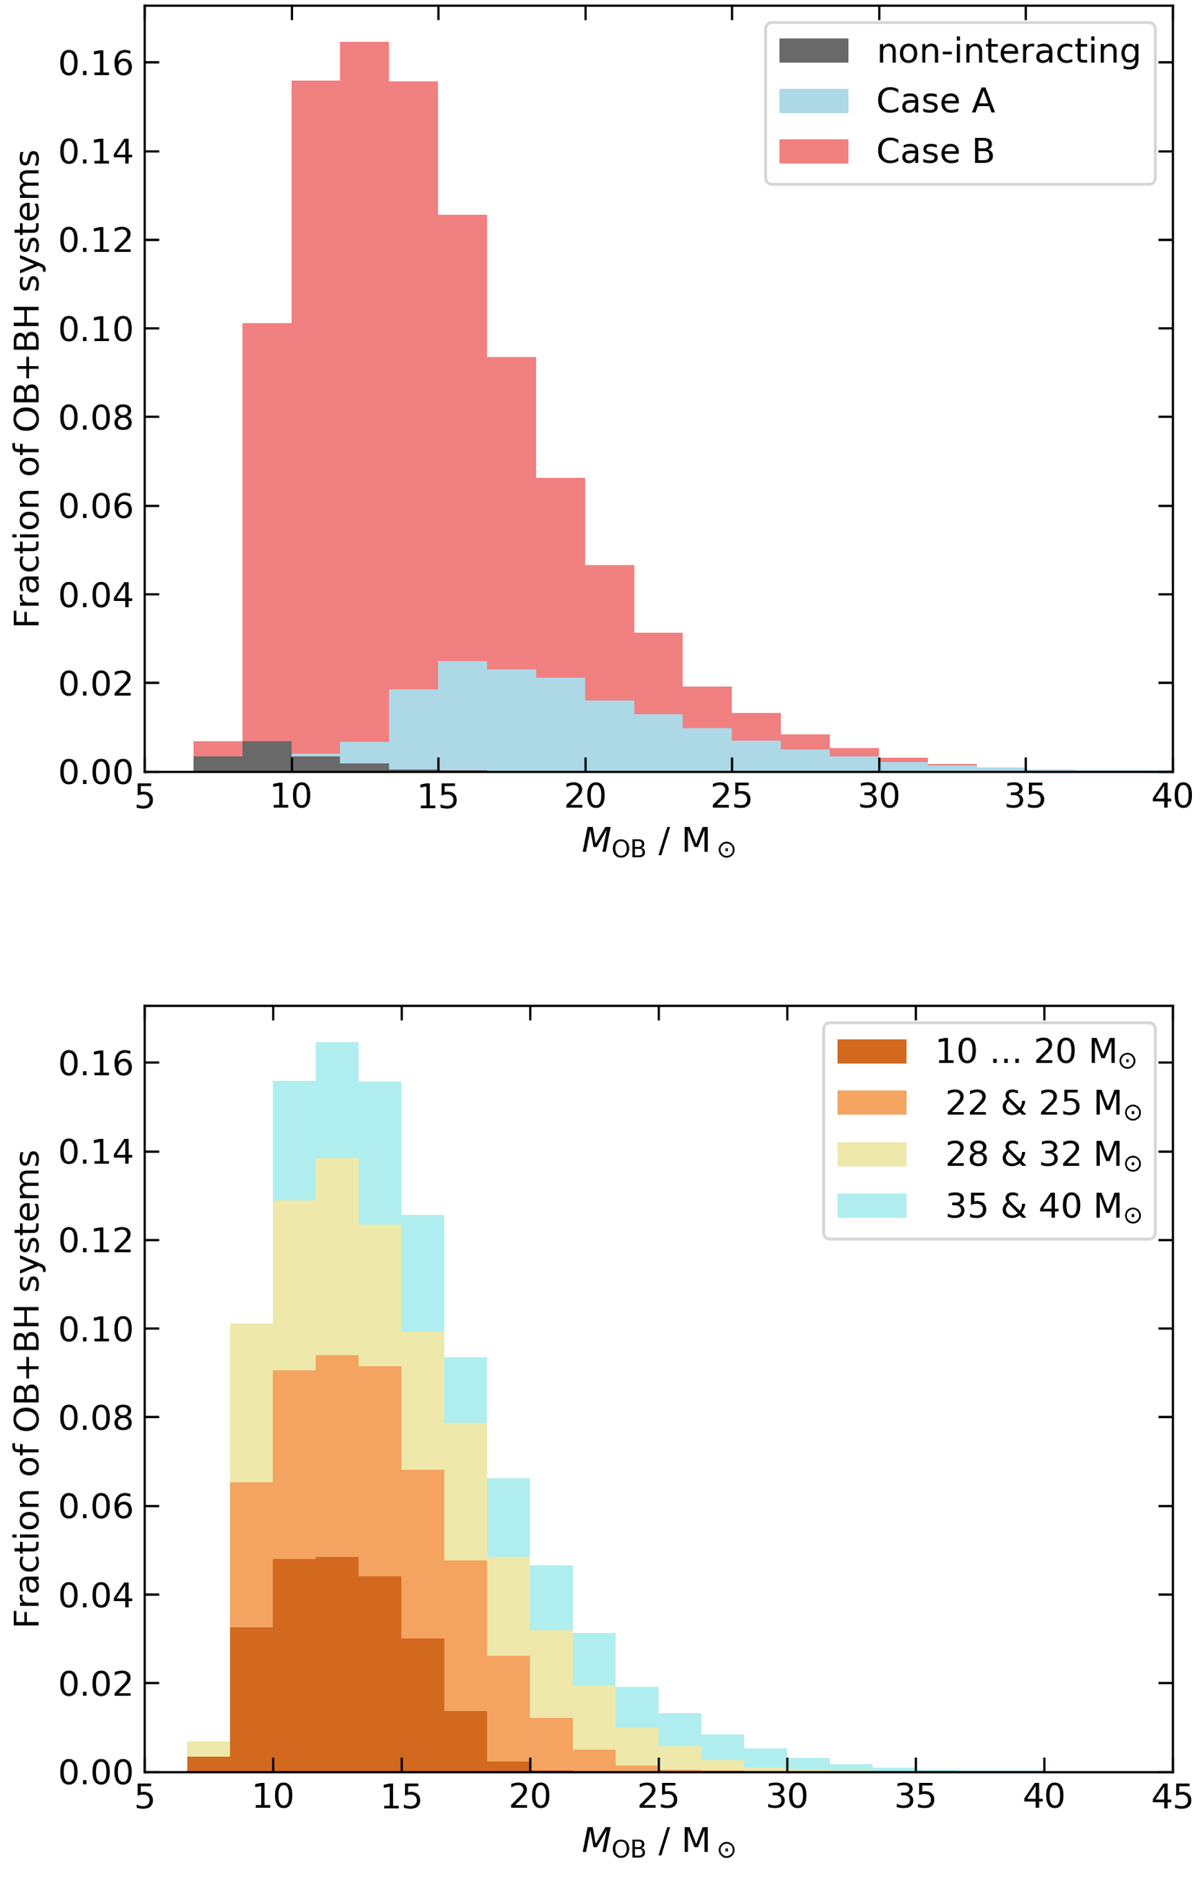
Top: distribution of the OB star masses of systems in our binary evolution model grid that reach the OB+BH stage, assuming constant star formation, weighted with the initial mass function and the initial binary parameter distribution functions, and with their lifetime as OB+BH binary. The red and blue areas represent Case B and Case A systems. Black indicates the small number of non-interacting systems in our binary grid. The results are stacked, such that the upper envelope corresponds to the total number of systems. The ordinate values are normalised such that the value for each bin gives its relative contribution to the total number of systems. Bottom: same distribution as in the top plot, but different initial masses of the BH progenitors are distinguished (see legend).
Current usage metrics show cumulative count of Article Views (full-text article views including HTML views, PDF and ePub downloads, according to the available data) and Abstracts Views on Vision4Press platform.
Data correspond to usage on the plateform after 2015. The current usage metrics is available 48-96 hours after online publication and is updated daily on week days.
Initial download of the metrics may take a while.