Fig. 2.
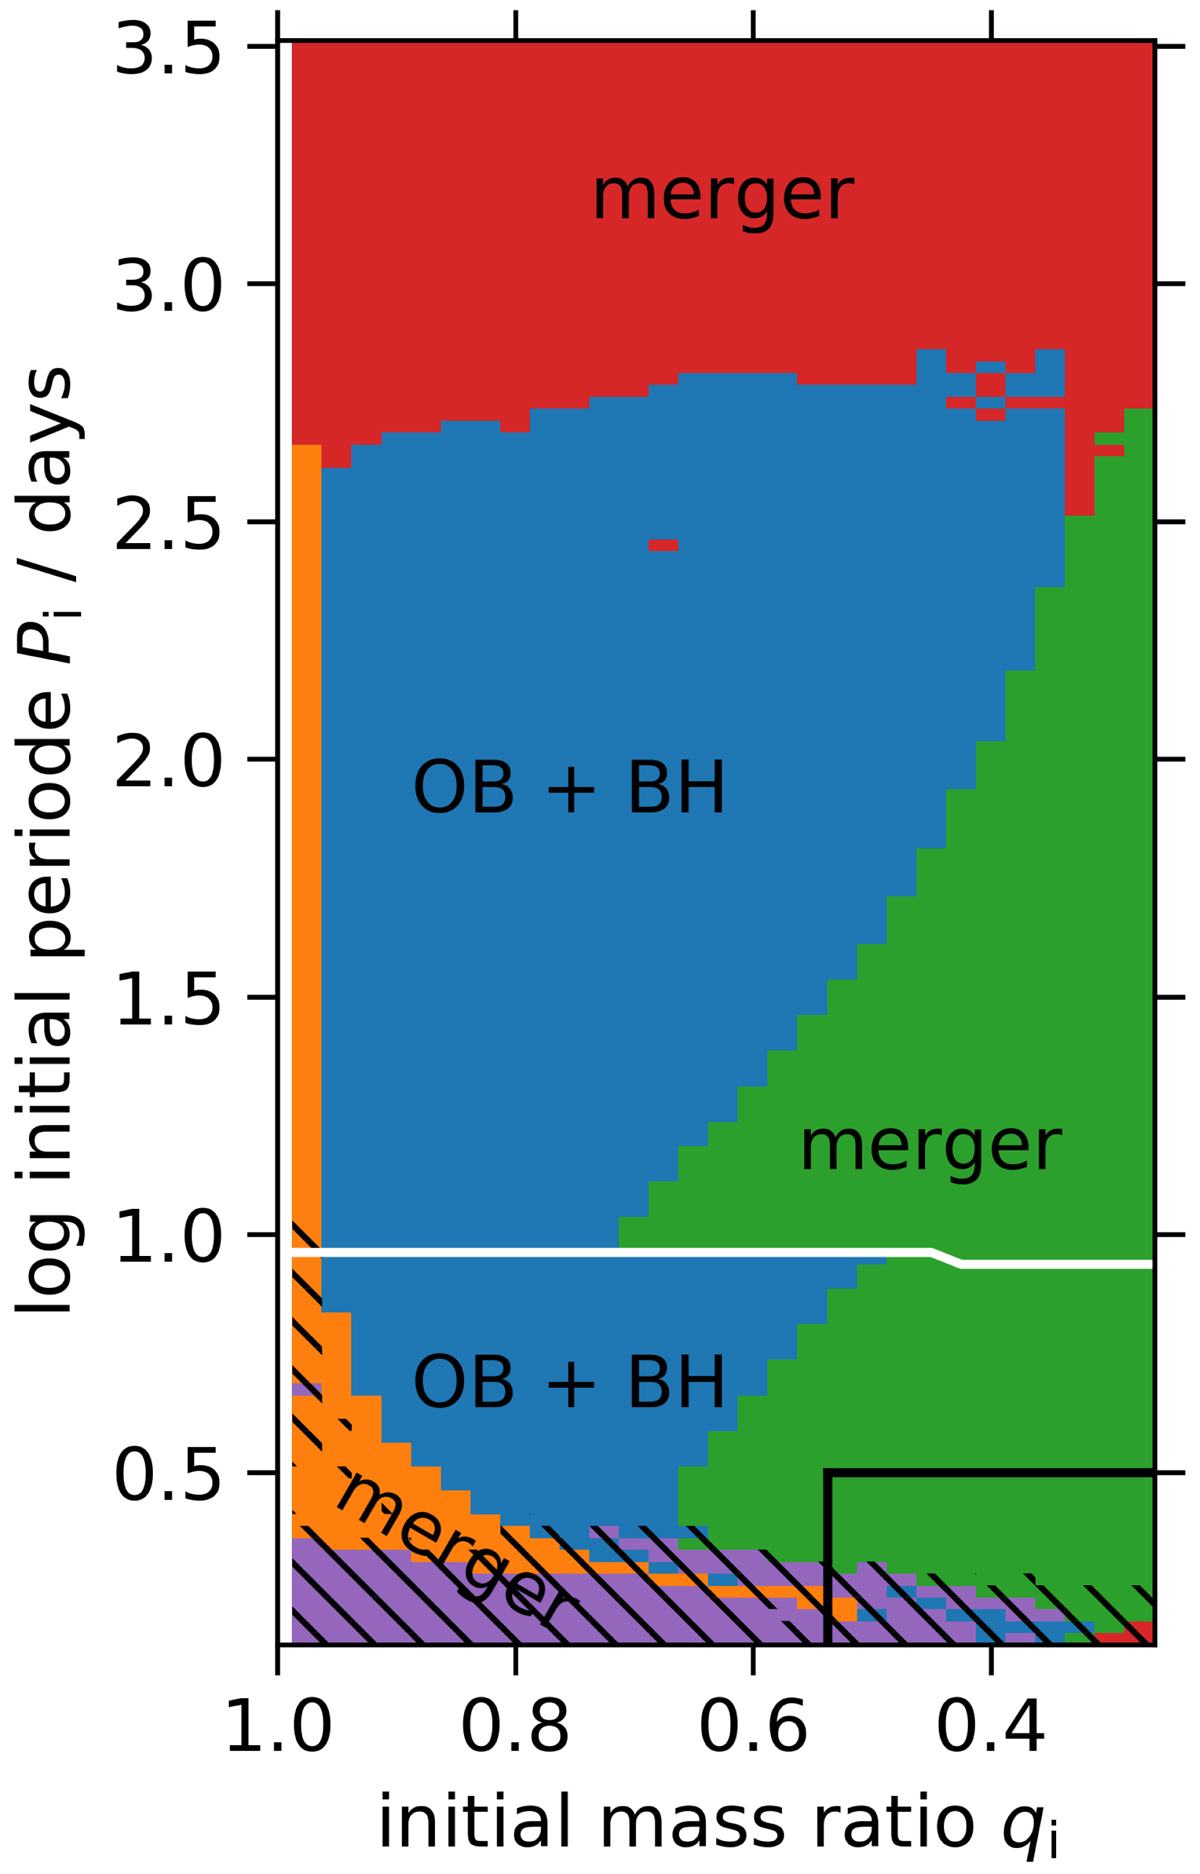
Outcome of the 4020 binary evolution models with an initial primary mass of log M/M⊙ = 1.4 (∼25.12 M⊙) as function of their initial orbital period Pi and mass ratio qi. Each of the 30 × 134 pixels in this plot represents one detailed binary evolution model. The dark blue systems evolve to the OB+BH stage. Systems that evolve into a contact configuration are marked by black hatching. Purple indicates systems that evolve into mass overflow at the outer Lagrangian point L2, and systems that evolve into inverse mass transfer occurring from a post-main-sequence component are marked in yellow; we assume that the binaries merge in both situations. We also assume those systems to merge that exceed the upper mass-loss rate limit (see main text), marked in green. The systems with the longest initial orbital periods, marked in red, impart a classical common-envelope evolution; for simplicity, we assume that all of them merge as well. Systems below the nearly horizontal white line undergo the first mass transfer while both stars are core hydrogen burning (Case A), while the primaries in initially wider systems start mass transfer after core hydrogen exhaustion (Case B). The area framed by the black line in the lower right corner marks the part of the parameter space that is disregarded in our results (see Sect. 2). Equivalent plots for four more initial primary masses are provided in the appendix.
Current usage metrics show cumulative count of Article Views (full-text article views including HTML views, PDF and ePub downloads, according to the available data) and Abstracts Views on Vision4Press platform.
Data correspond to usage on the plateform after 2015. The current usage metrics is available 48-96 hours after online publication and is updated daily on week days.
Initial download of the metrics may take a while.