Fig. B.1.
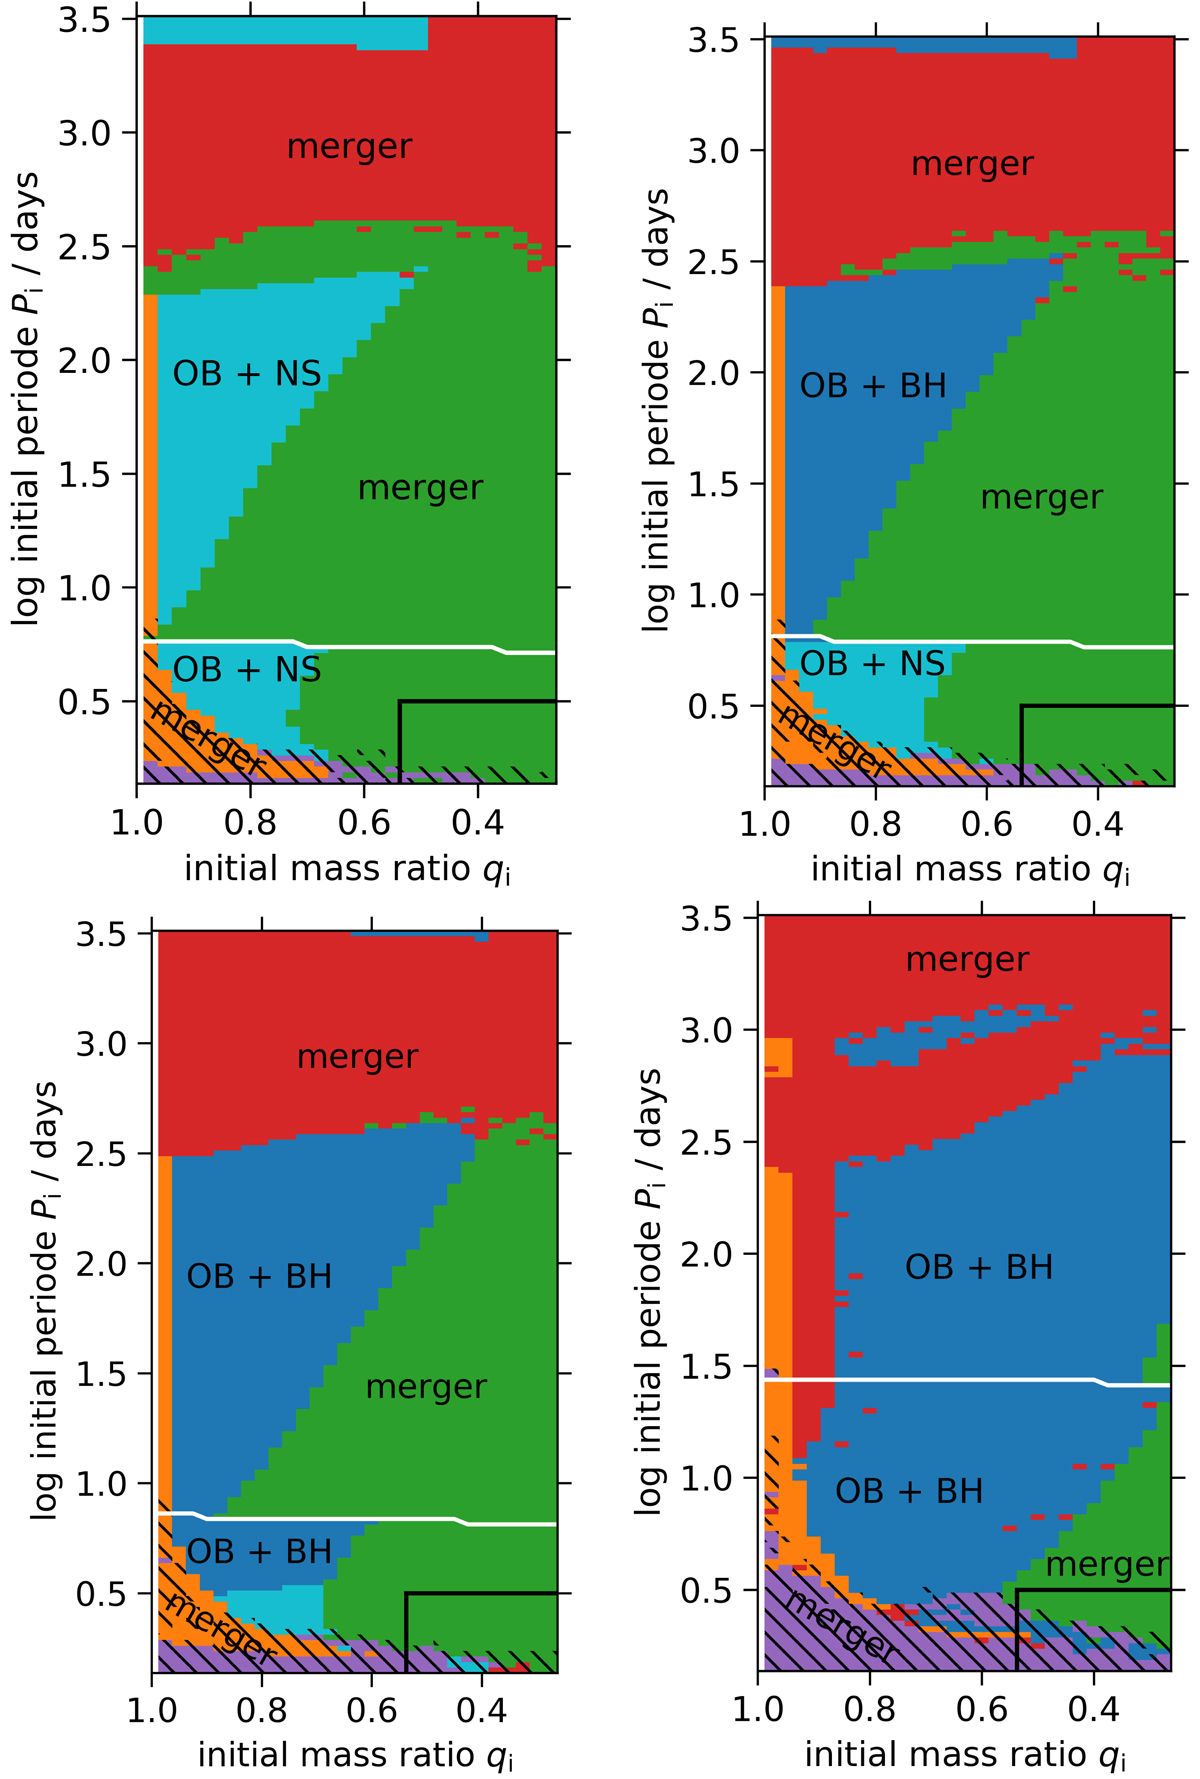
As Fig. 2, but for initial primary masses of 15.85 M⊙ (top left), 17.78 M⊙ (top right), 19.95 M⊙ (bottom left), and 39.81 M⊙ (bottom right). The colour-coding indicates fates as in Fig. 2 (purple: L2-overflow, yellow: inverse mass transfer, green: mass-loss limit violation, and red: common-envelope evolution; all assumed to lead to a merger). Black hatching marks contact evolution, and the dark blue systems evolve to the OB+BH stage. Here, light blue marks systems where the mass donor is assumed to form a NS rather than a BH. The white line separates Case A and Case B evolution, and the area framed by the black line in the lower right corner marks the part of the parameter space that is disregarded in our results (see Sect. 2).
Current usage metrics show cumulative count of Article Views (full-text article views including HTML views, PDF and ePub downloads, according to the available data) and Abstracts Views on Vision4Press platform.
Data correspond to usage on the plateform after 2015. The current usage metrics is available 48-96 hours after online publication and is updated daily on week days.
Initial download of the metrics may take a while.