Fig. 9
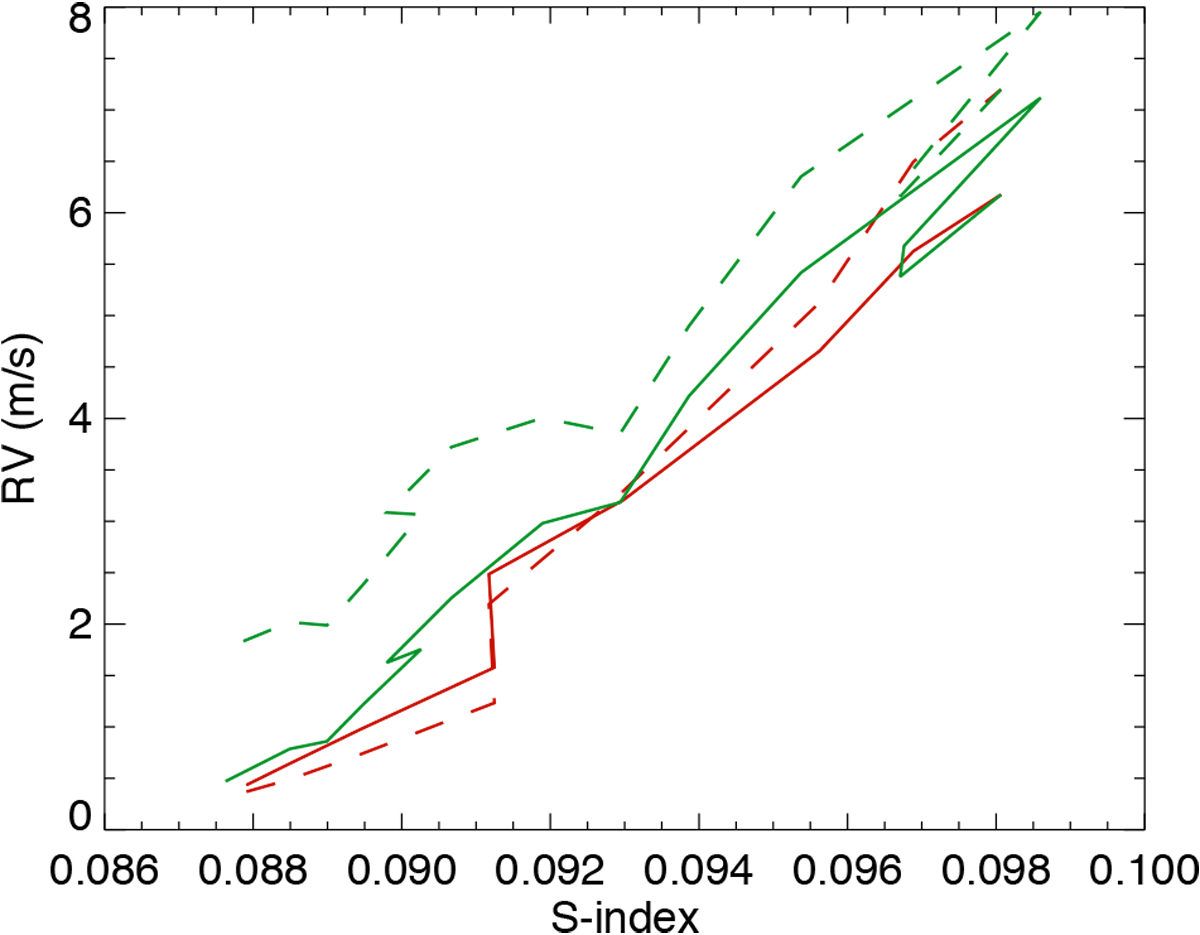
Radial velocity vs. Sacramento Peak Observatory chromospheric emission index, both binned over 6 months, for activity alone (solid lines) and for activity superposed on meridional flows (dashed lines). Red curves correspond to the ascending phase of cycle 23, and green curves to the descending phase. Curves are arbitrarily shifted in RV.
Current usage metrics show cumulative count of Article Views (full-text article views including HTML views, PDF and ePub downloads, according to the available data) and Abstracts Views on Vision4Press platform.
Data correspond to usage on the plateform after 2015. The current usage metrics is available 48-96 hours after online publication and is updated daily on week days.
Initial download of the metrics may take a while.