Fig. 7
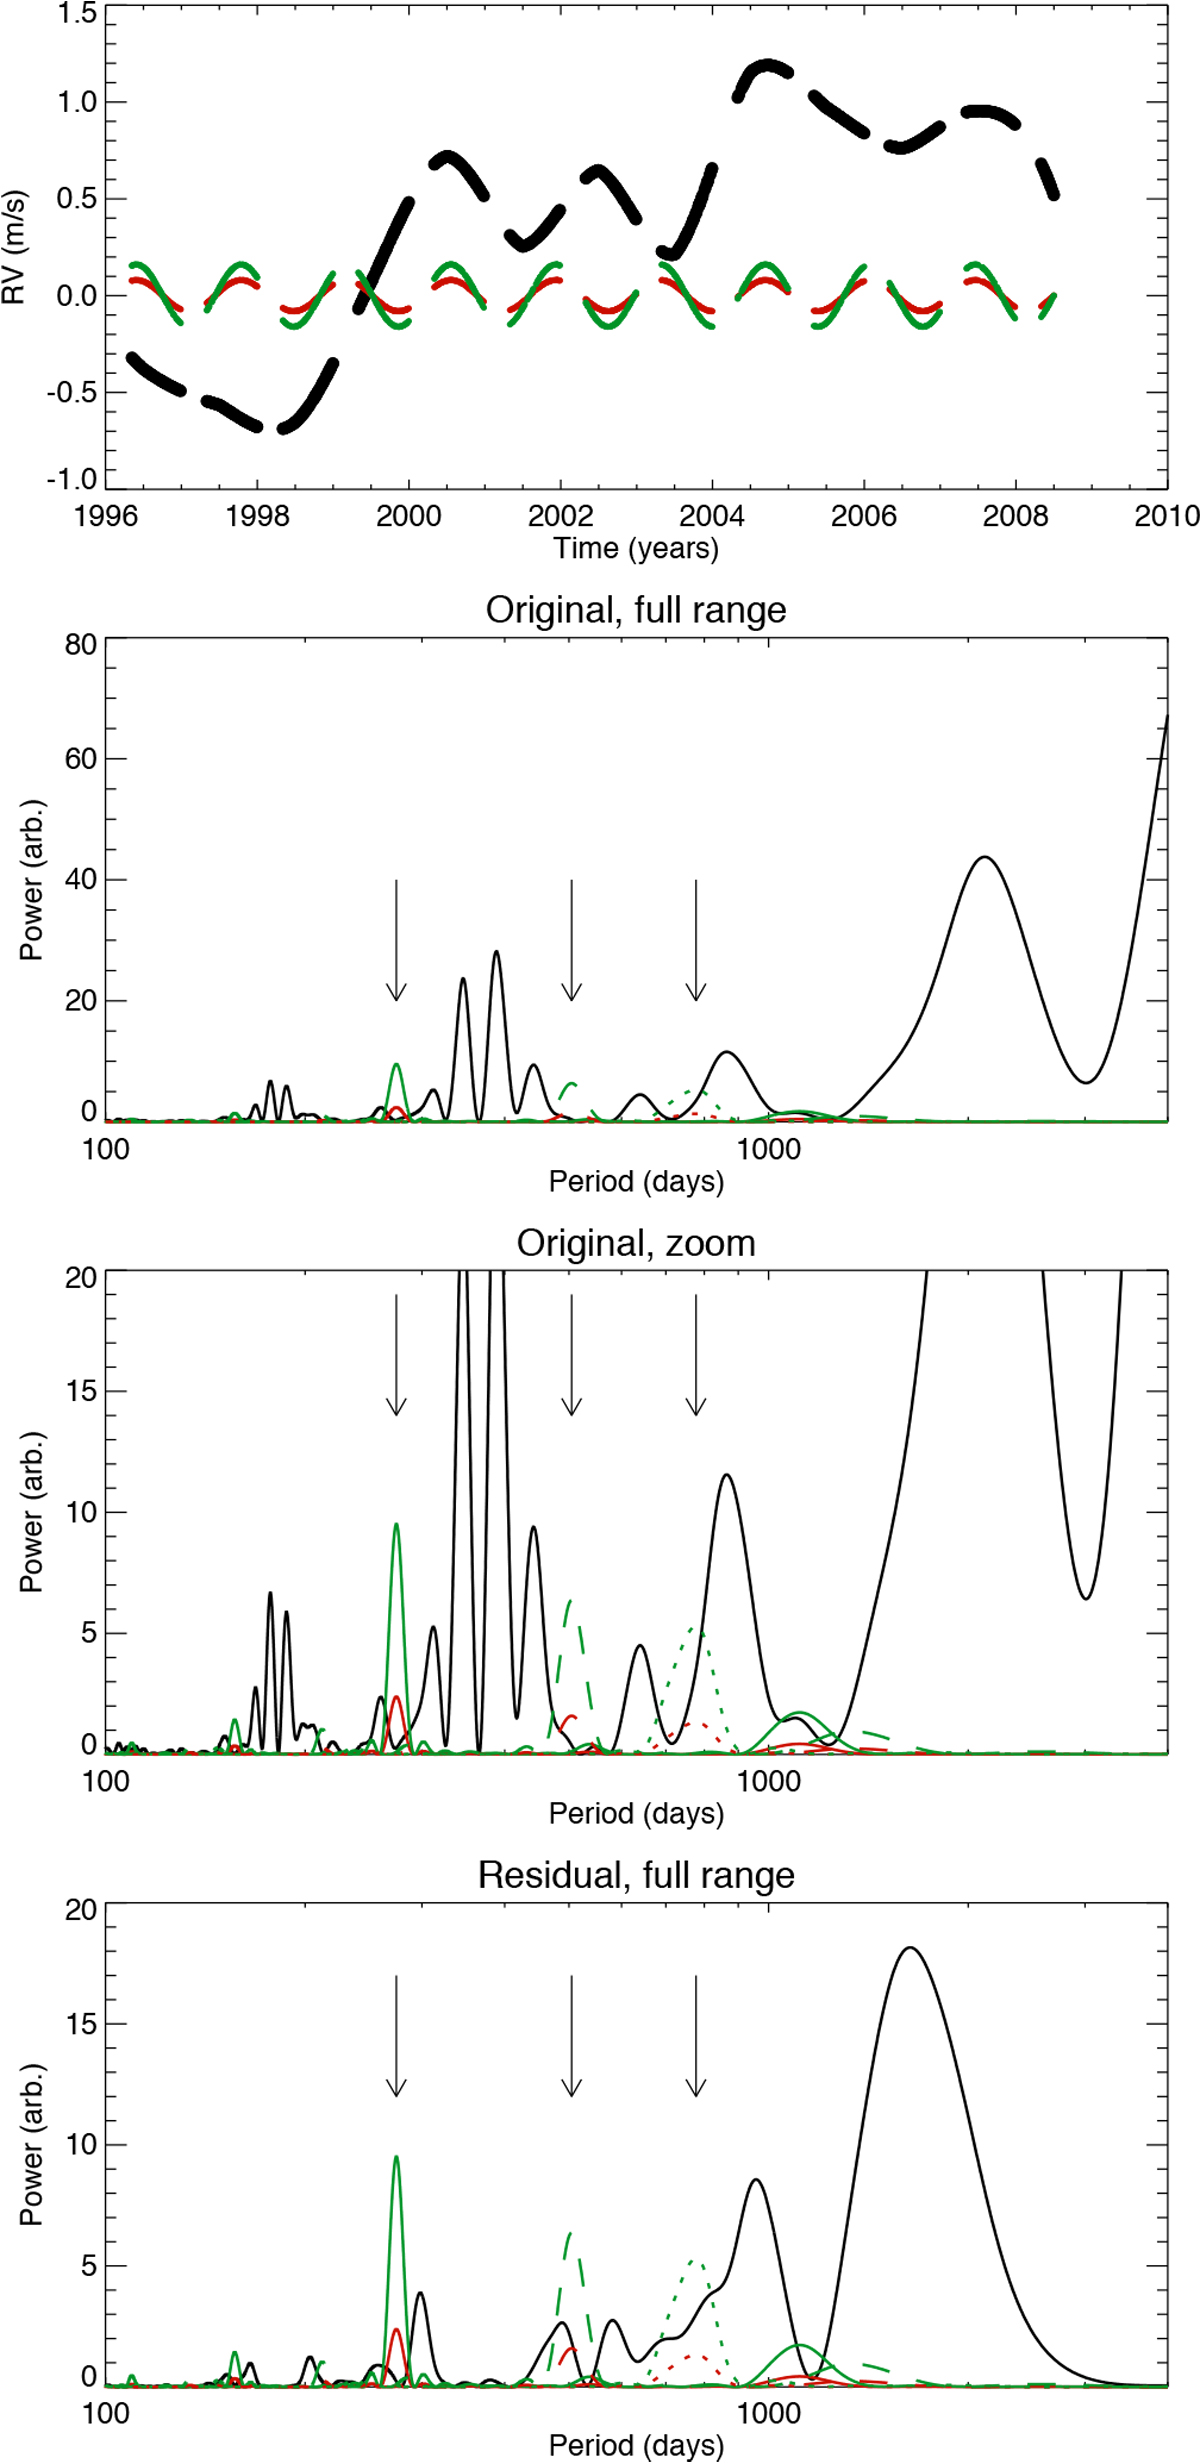
Radial velocity due to edge-on meridional flows vs. time (stars and solid line) and due to 1 (red) and 2 (green) Earth-mass planets in the middle of the habitable zone (first panel). The two following panels show the periodograms for the meridional flow (black; full range, then focusing on small powers). The planet periodograms are shown for different orbital periods: inner side of the habitable zone (solid), middle (dashed), and external side (dotted), and the planet peaks are indicated by arrows. Last panel: similar but for the residuals after the sinusoidal correction (see text).
Current usage metrics show cumulative count of Article Views (full-text article views including HTML views, PDF and ePub downloads, according to the available data) and Abstracts Views on Vision4Press platform.
Data correspond to usage on the plateform after 2015. The current usage metrics is available 48-96 hours after online publication and is updated daily on week days.
Initial download of the metrics may take a while.