Fig. 5
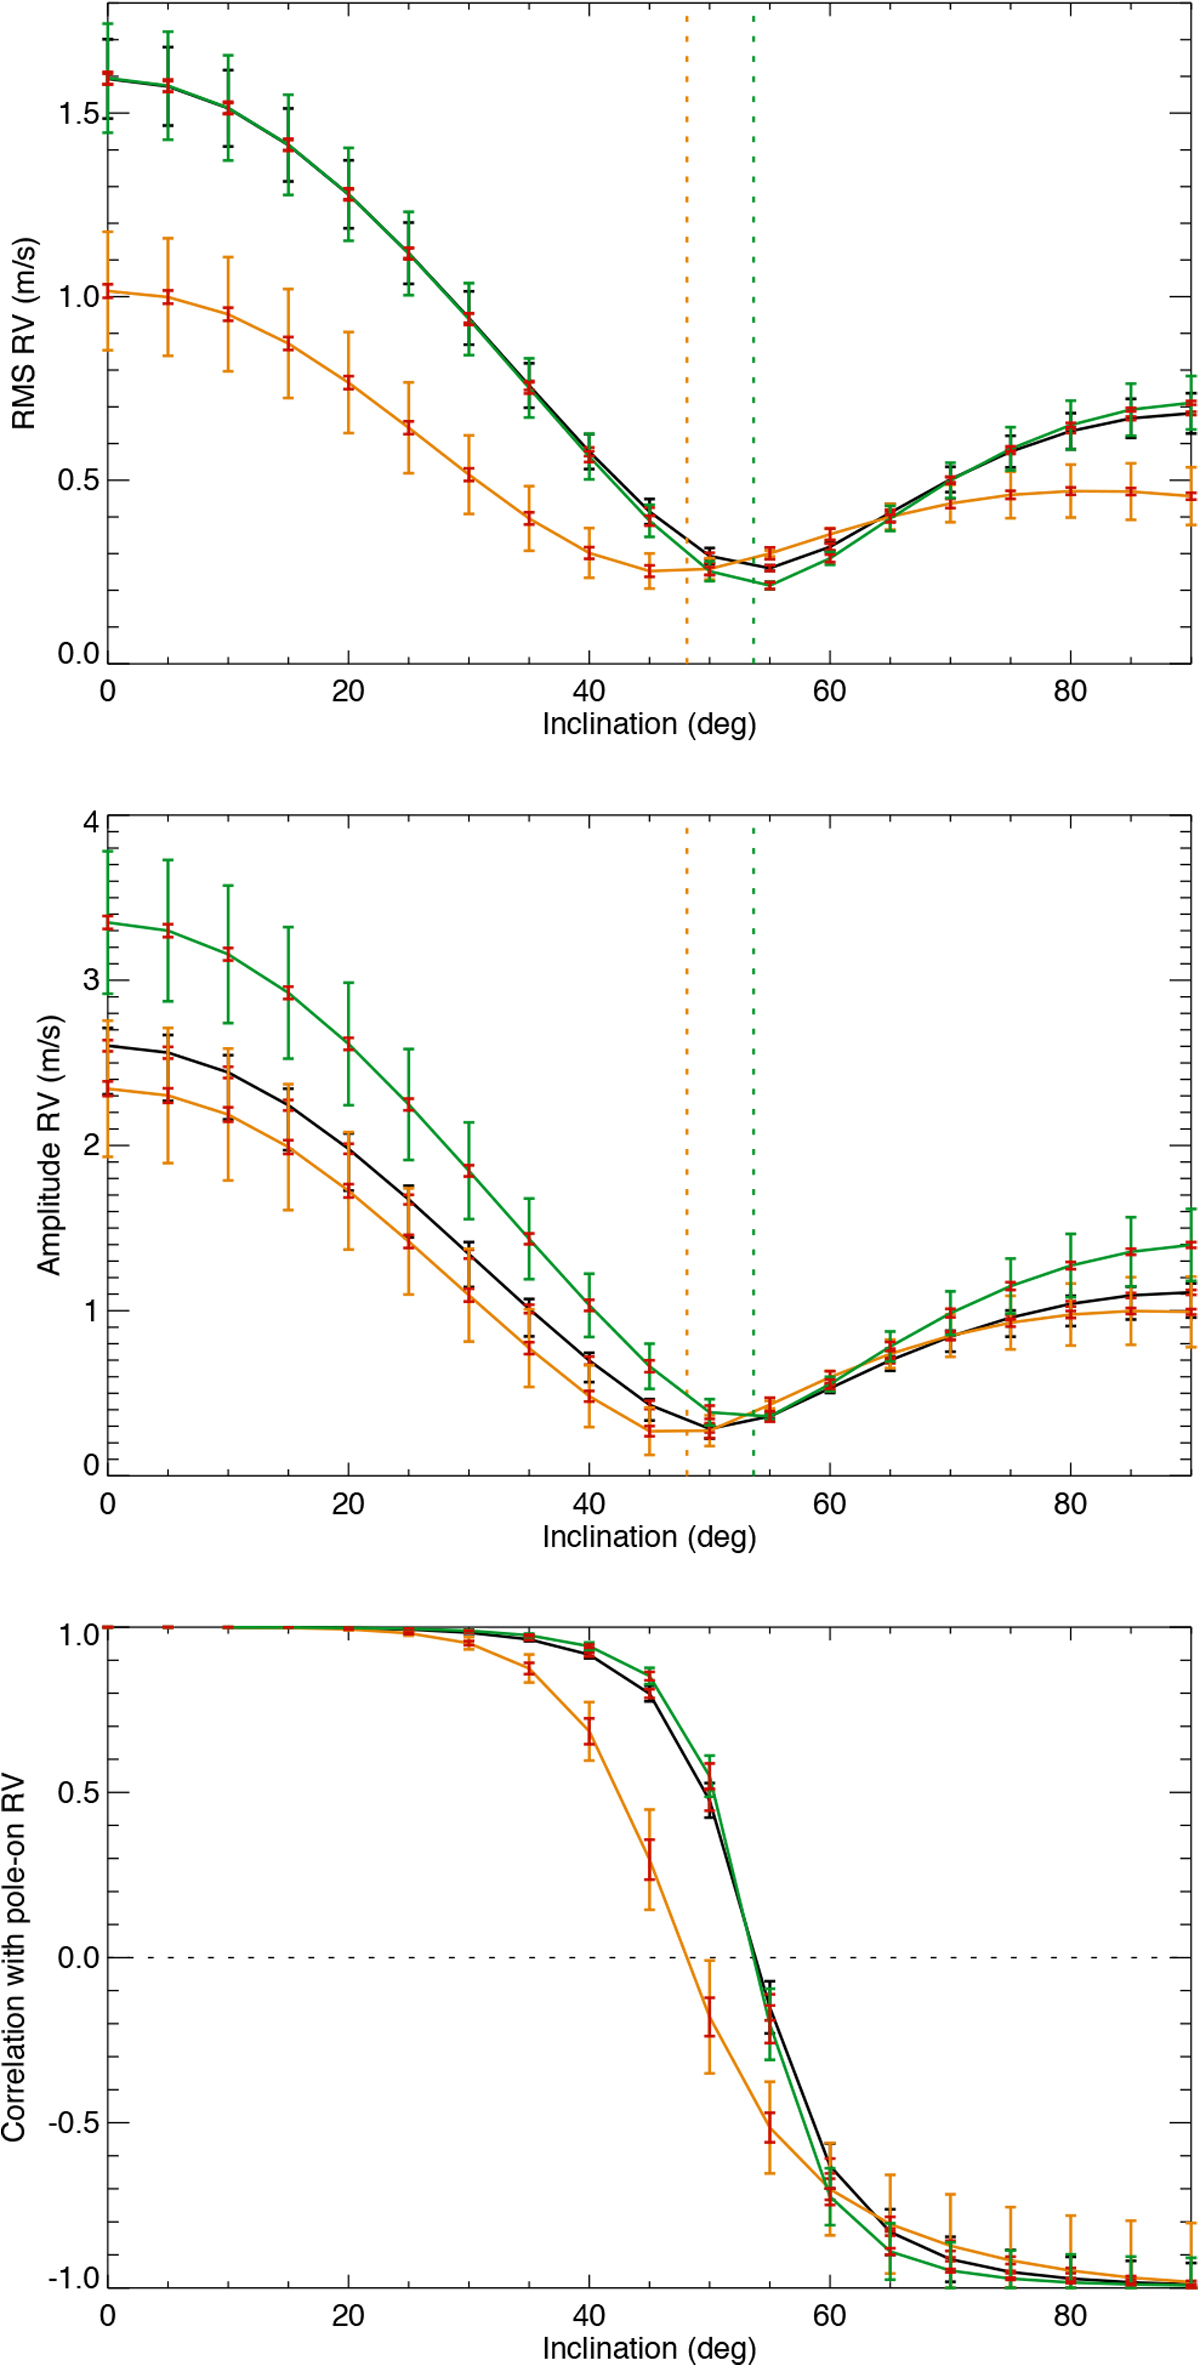
Root mean square of meridional flow time series (upper panel), peak-to-peak amplitude (middle panel), and correlation of meridional time series with pole-on time series (lower panel) vs. stellar inclination, for U10 reconstruction: full time series (black), cycle 22 (orange), and cycle 23 (green). The uncertainties with the same colour correspond to the upper limits, and those in red to the lower limit. The vertical dotted lines indicate the position of the reversals for the two cycles.
Current usage metrics show cumulative count of Article Views (full-text article views including HTML views, PDF and ePub downloads, according to the available data) and Abstracts Views on Vision4Press platform.
Data correspond to usage on the plateform after 2015. The current usage metrics is available 48-96 hours after online publication and is updated daily on week days.
Initial download of the metrics may take a while.