Fig. 4
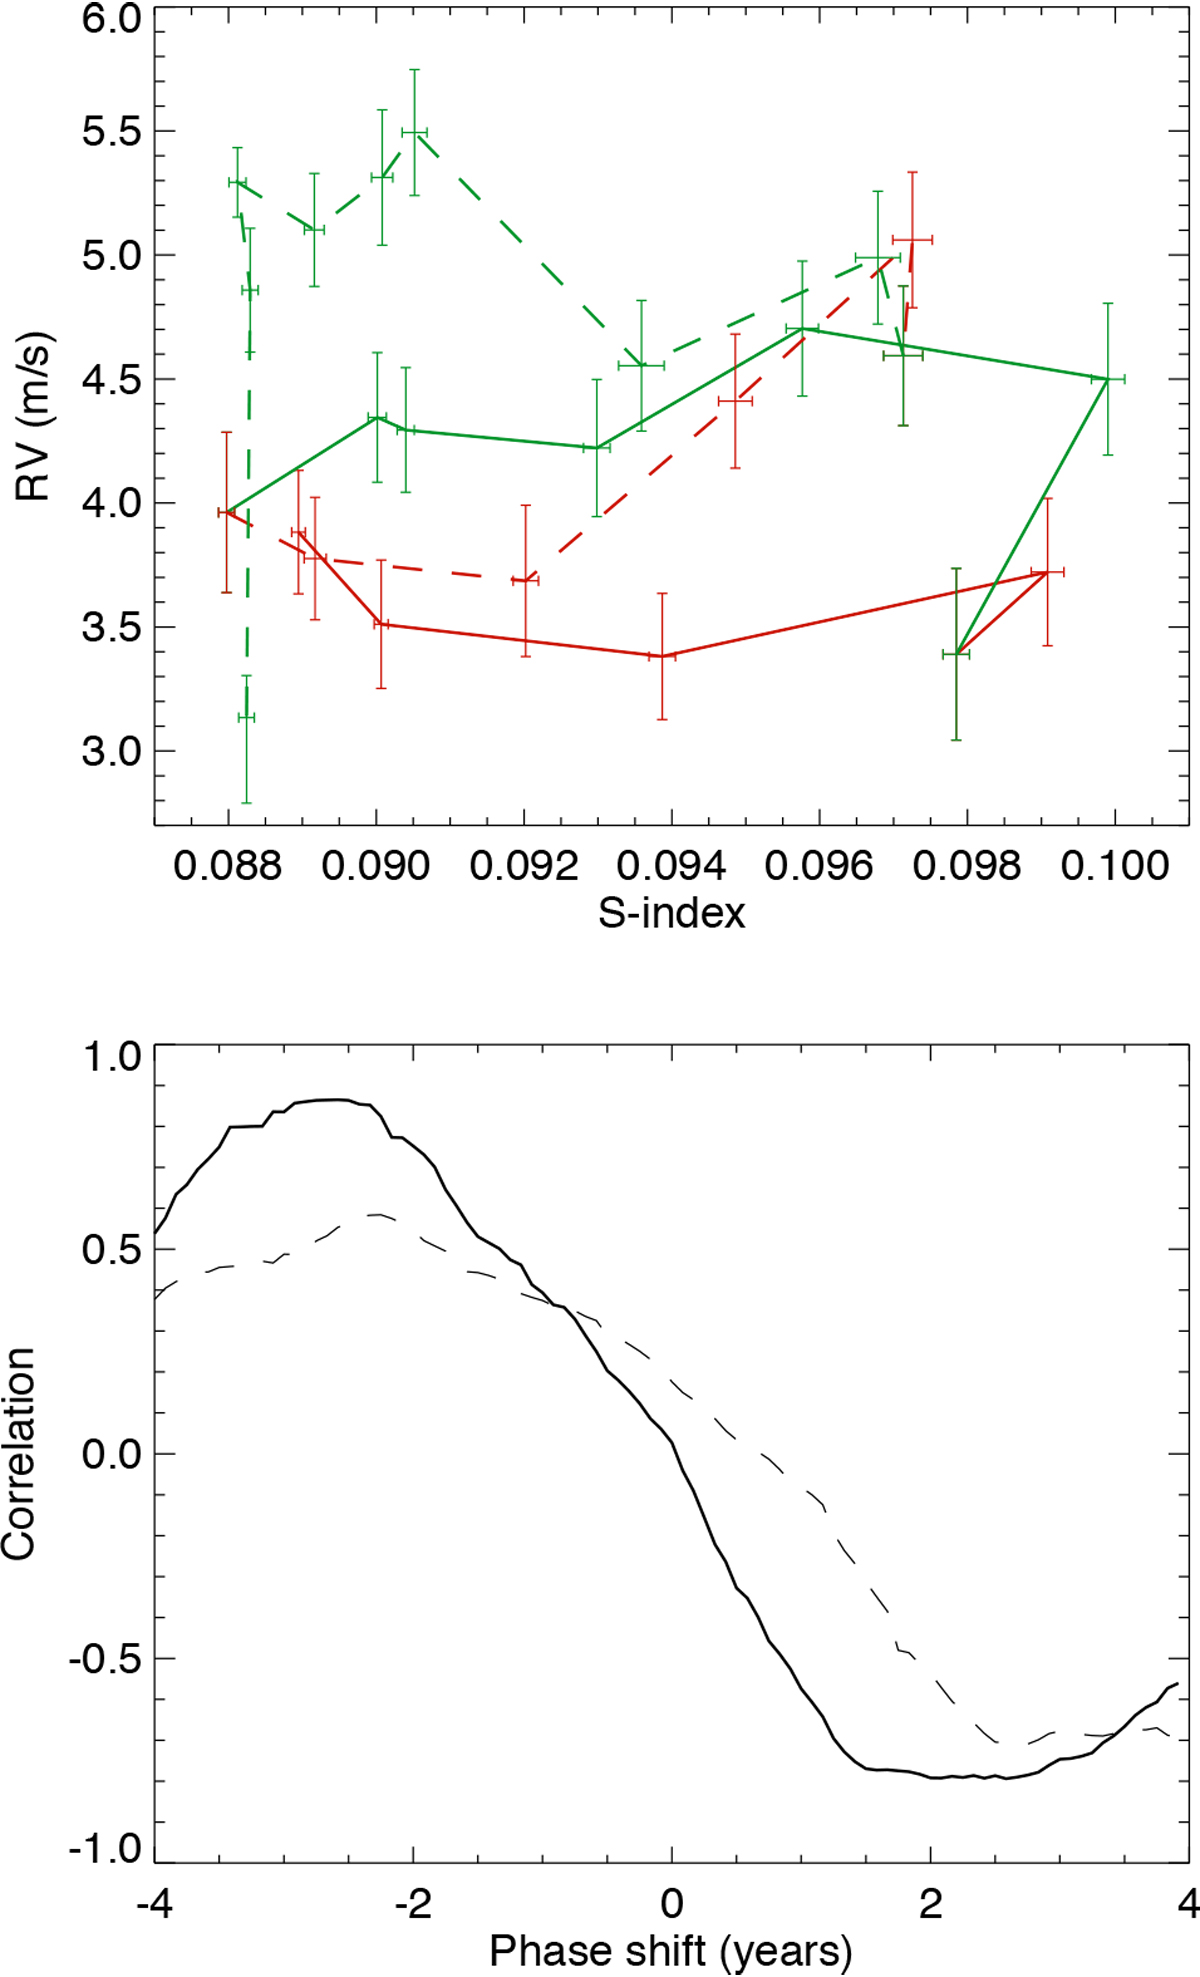
Meridional flow vs. S-index (upper panel) for pole-on configuration for cycle 22 (solid line) and cycle 23 (dashed line): ascending phases are shown in red and descending phases in green. The uncertainties in RV are the upper limits. Lower panel: cross-correlation functions between S-index and meridional flows for cycles 22 (solid line) and 23 (dashed line).
Current usage metrics show cumulative count of Article Views (full-text article views including HTML views, PDF and ePub downloads, according to the available data) and Abstracts Views on Vision4Press platform.
Data correspond to usage on the plateform after 2015. The current usage metrics is available 48-96 hours after online publication and is updated daily on week days.
Initial download of the metrics may take a while.