Fig. 3
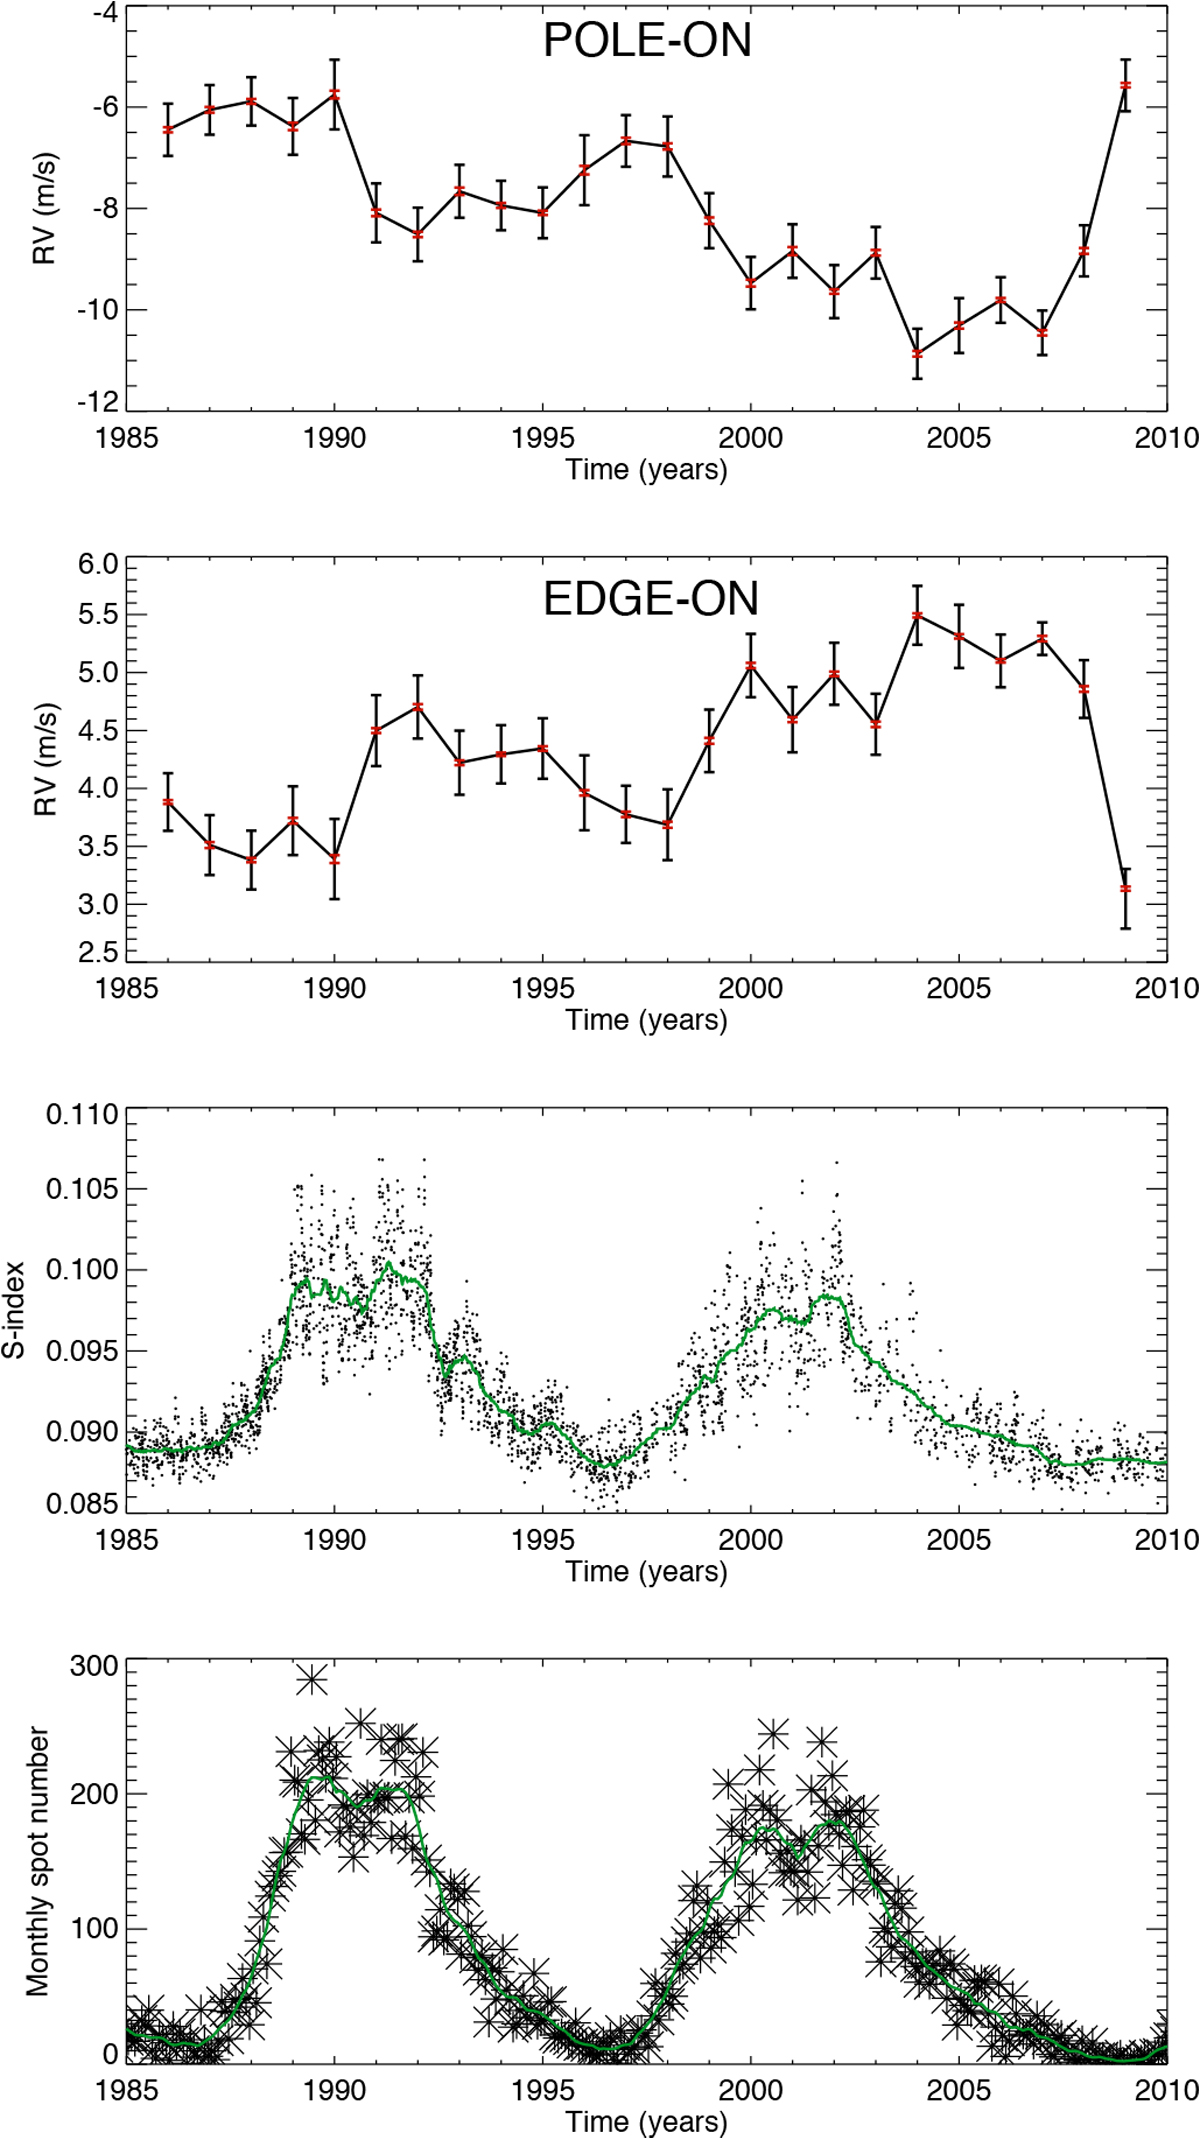
Time series of integrated meridional flows for pole-on configuration (first panel) and edge-on configuration (second panel) for U10 reconstruction. Two types of uncertainties are shown (see text): a lower limit (red) and an upper limit (black). Third panel: S-index from Sacramento Peak Observatory between 1985 and 2011 (the solid line corresponds to a smoothingover 100 days). Last panel: monthly spot number (stars), superposed on a smoothed time series as a solid line.
Current usage metrics show cumulative count of Article Views (full-text article views including HTML views, PDF and ePub downloads, according to the available data) and Abstracts Views on Vision4Press platform.
Data correspond to usage on the plateform after 2015. The current usage metrics is available 48-96 hours after online publication and is updated daily on week days.
Initial download of the metrics may take a while.