Open Access
Fig. 2
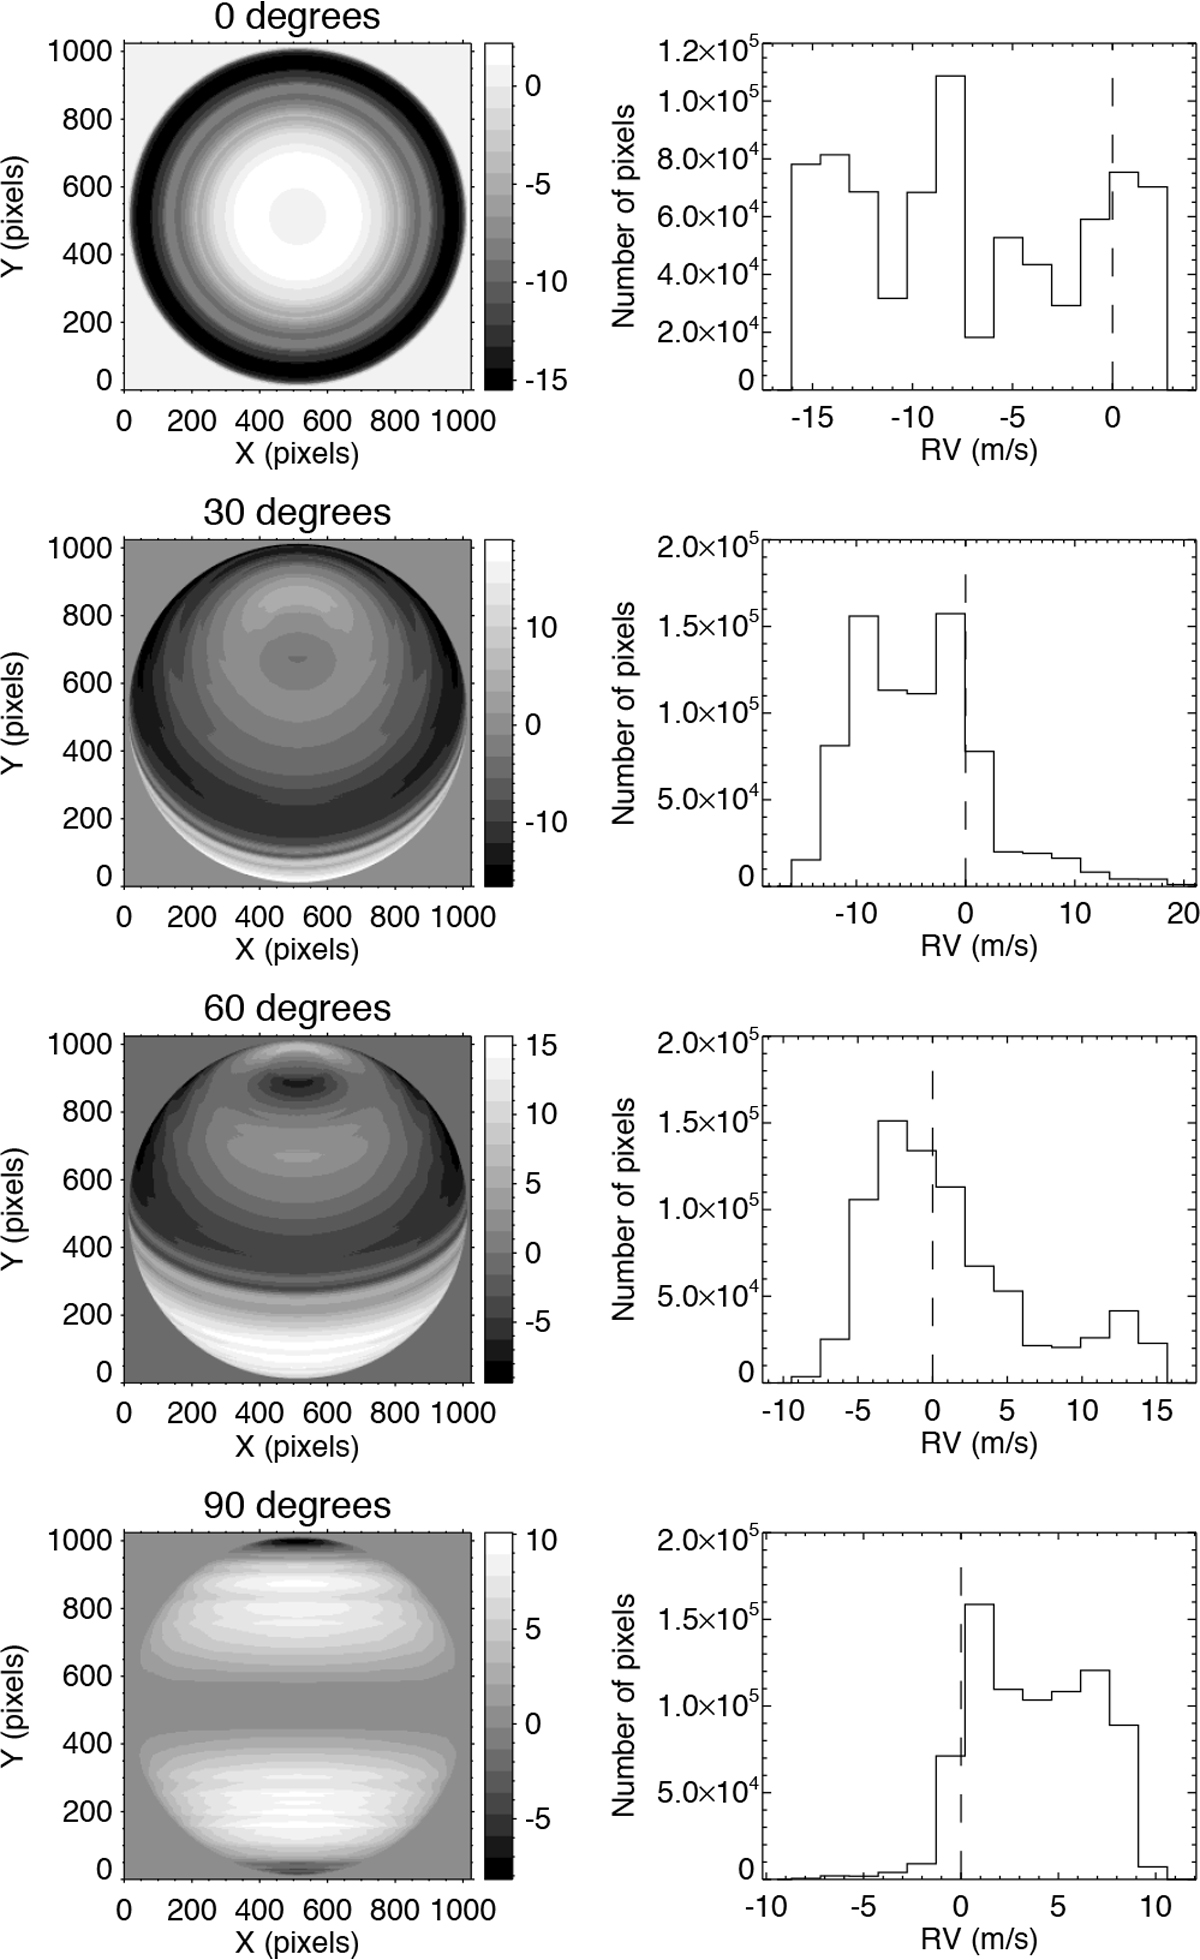
Examples of maps (left panels) and corresponding velocity distributions (right panels) over the solar disc for inclinations of 0°, 30°, 60°, and 90° (from top to bottom), for the 1986 latitudinal profile of Ulrich (2010). The levels are in metres per second, and are positive for redshifts.
Current usage metrics show cumulative count of Article Views (full-text article views including HTML views, PDF and ePub downloads, according to the available data) and Abstracts Views on Vision4Press platform.
Data correspond to usage on the plateform after 2015. The current usage metrics is available 48-96 hours after online publication and is updated daily on week days.
Initial download of the metrics may take a while.