Fig. 16
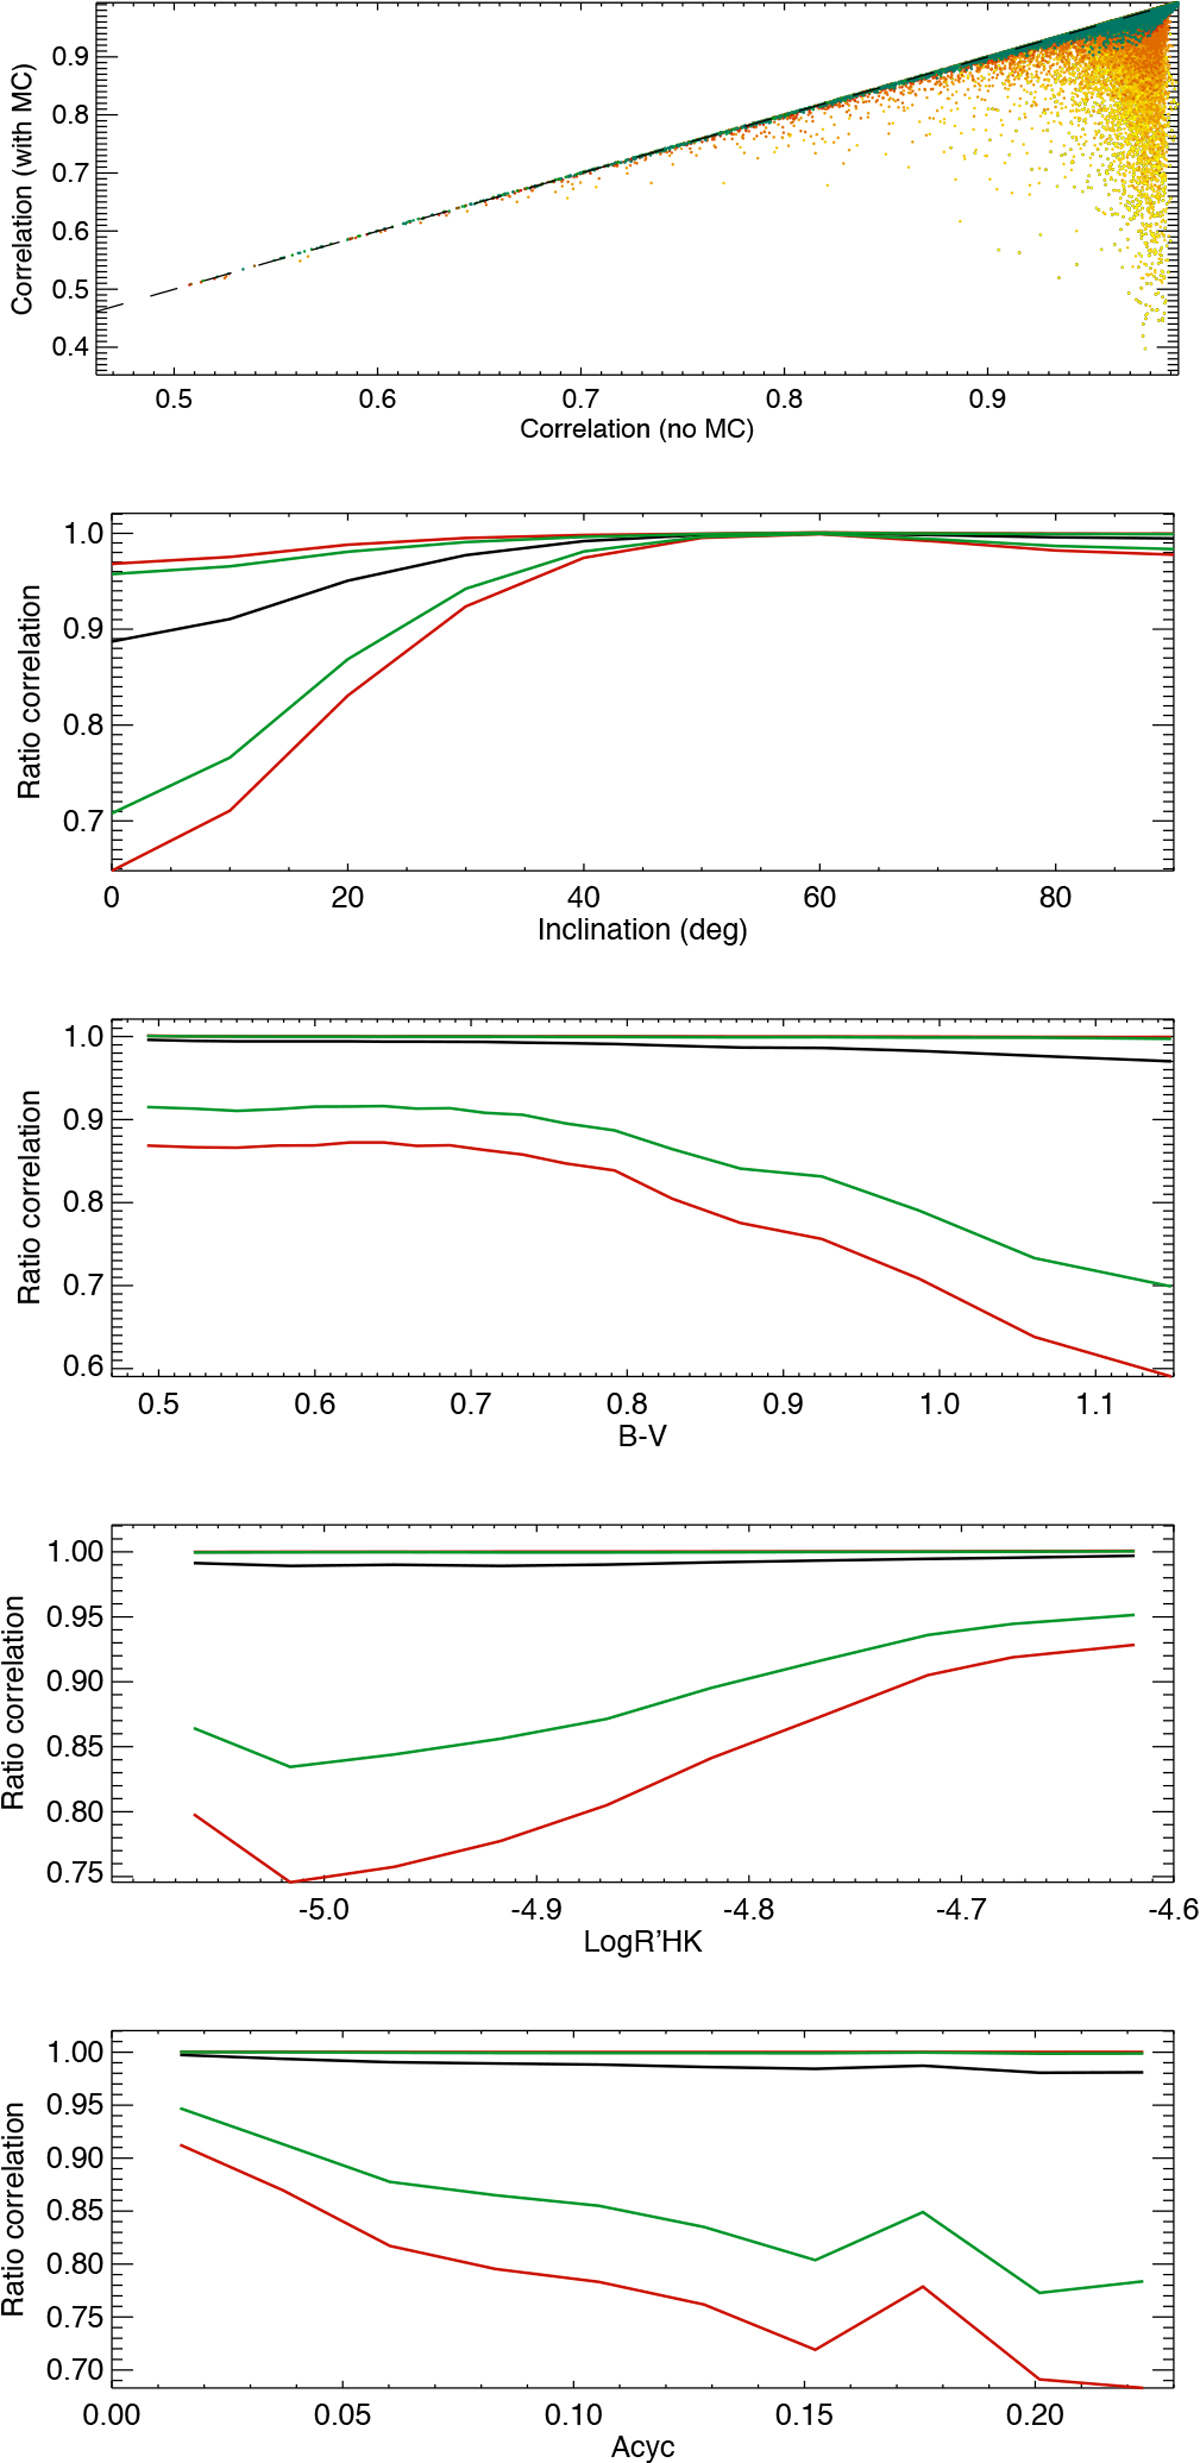
Correlation between activity+MC signal and ![]() vs. correlation with activity alone. The colour code represents inclination as in Fig. 15. The four following panels show the median ratio between correlation for activity+MC divided by correlation for activity alone vs. inclination,
B–V,
vs. correlation with activity alone. The colour code represents inclination as in Fig. 15. The four following panels show the median ratio between correlation for activity+MC divided by correlation for activity alone vs. inclination,
B–V,
![]() , and Acyc
(red lines). The green lines represent the 5th and 95th percentiles, and the dotted lines the 10th and 90th percentiles.
, and Acyc
(red lines). The green lines represent the 5th and 95th percentiles, and the dotted lines the 10th and 90th percentiles.
Current usage metrics show cumulative count of Article Views (full-text article views including HTML views, PDF and ePub downloads, according to the available data) and Abstracts Views on Vision4Press platform.
Data correspond to usage on the plateform after 2015. The current usage metrics is available 48-96 hours after online publication and is updated daily on week days.
Initial download of the metrics may take a while.