Fig. 15
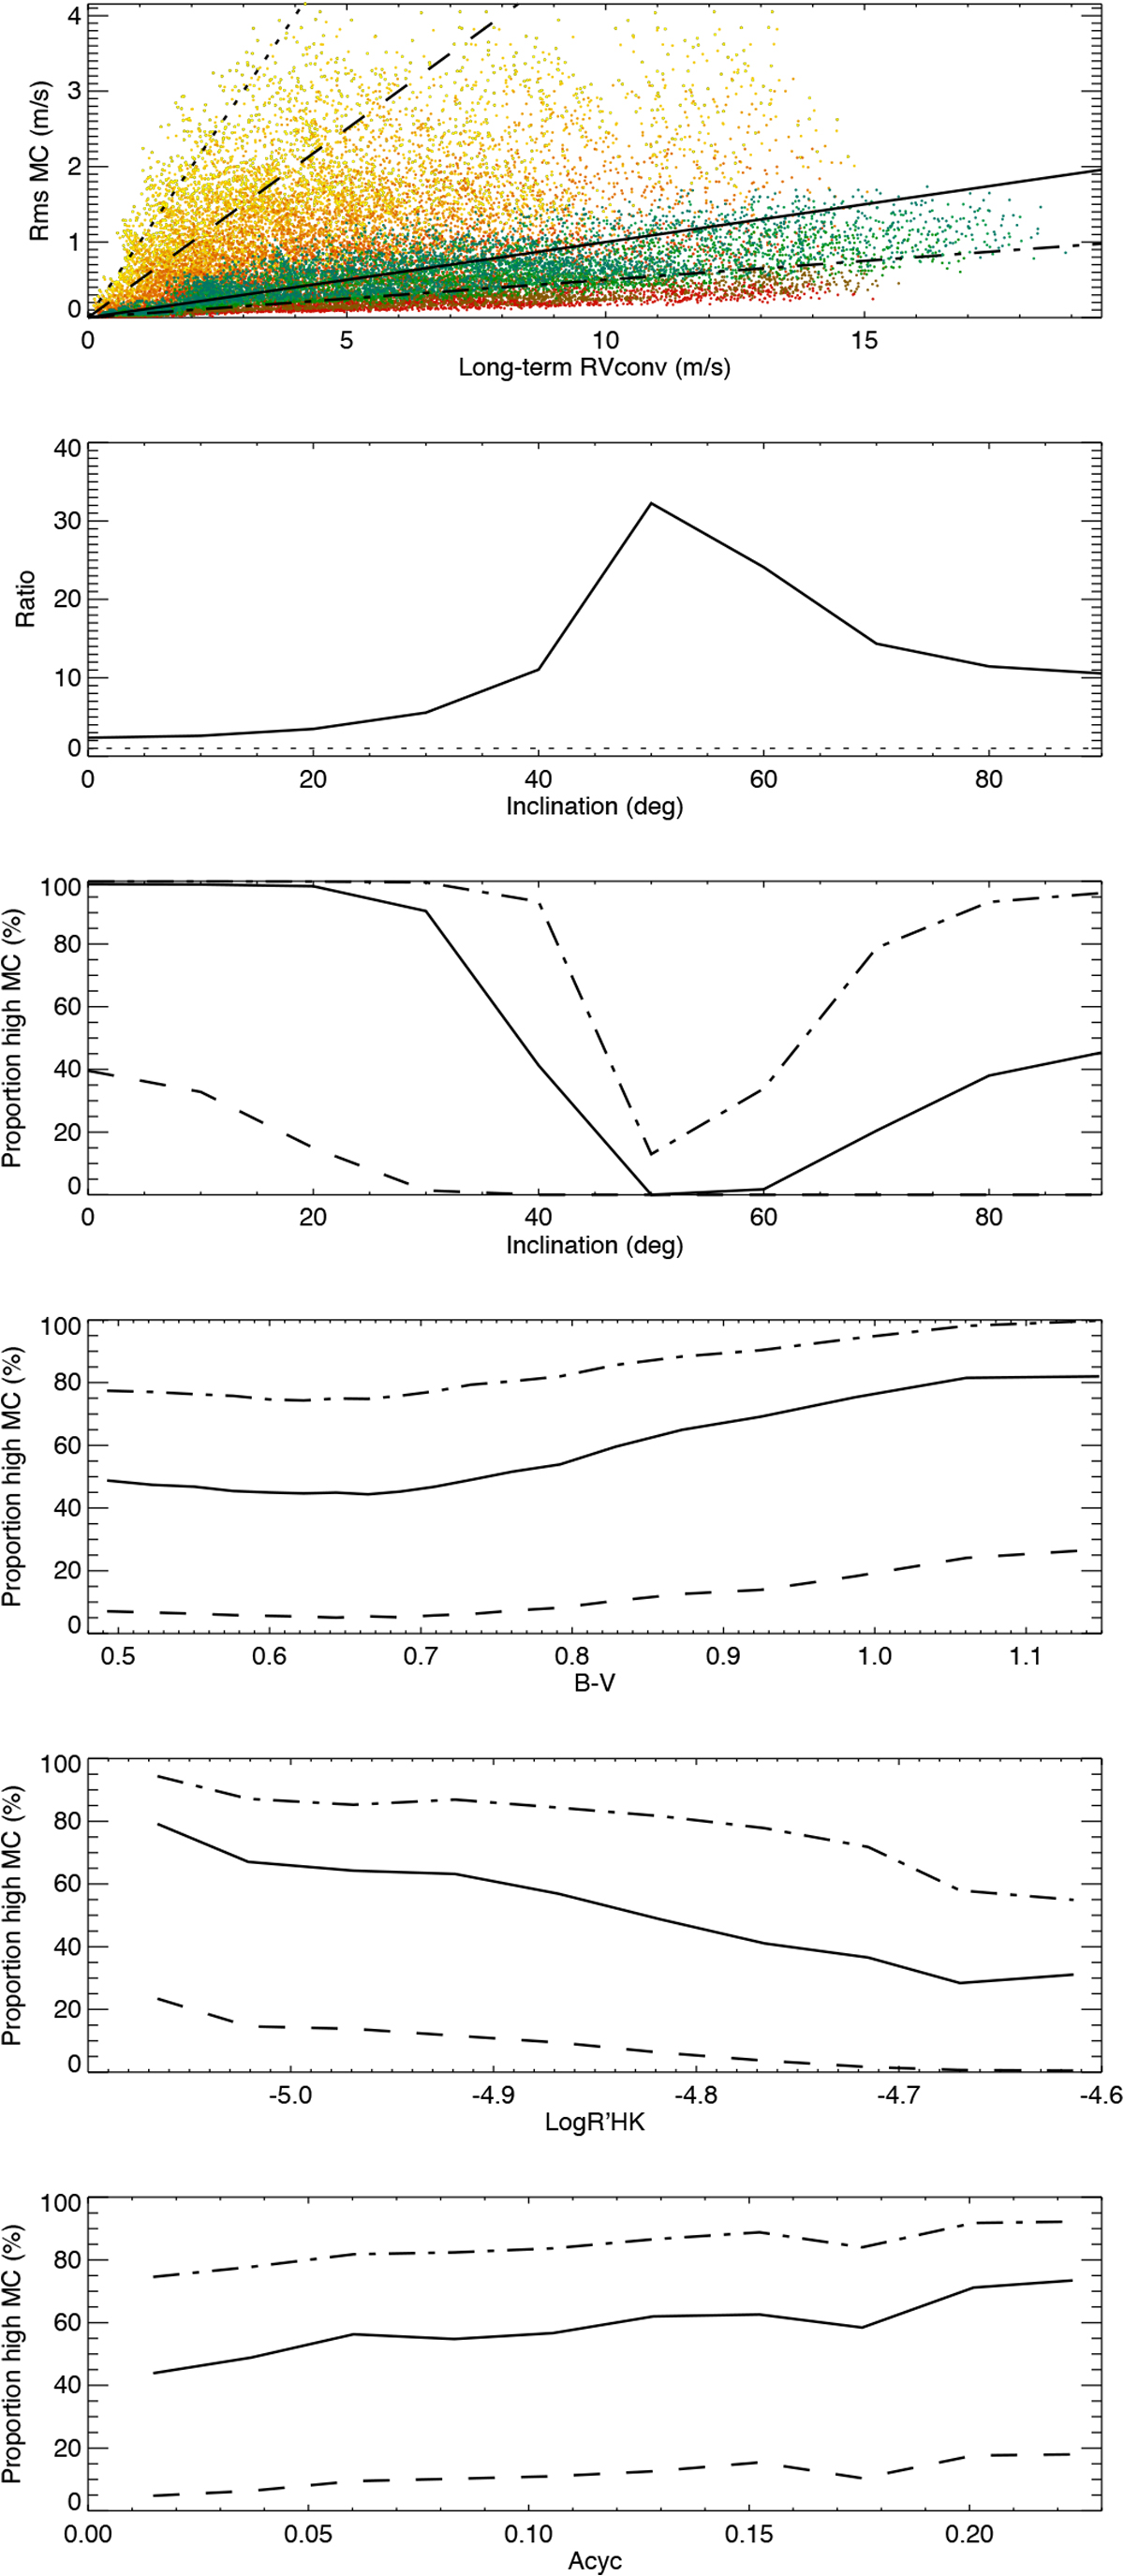
Meridional circulation amplitude vs. long-term amplitude of convective blueshift inhibition (upper panel) on our grid ofparameters (from Meunier et al. 2019b) for different inclinations (from pole-on in yellow to edge-on in blue). Only one point in five is shown for clarity. The straight lines correspond to MC amplitude representing 5% (dotted-dashed line), 10% (solid line), 50% (dashed line), and 100% (dotted line) of the convective blueshift inhibition. Second panel: median ratio between the convective blueshift inhibition component and MC vs. inclination. The four following panels show the percentage of simulations in which MC represents more than 5% (resp. 10, 50%) (in dotted-dashed lines, resp. solid lines, dashed lines) of the convective blueshift amplitude vs. inclination,
B–V,
![]() , and Acyc.
, and Acyc.
Current usage metrics show cumulative count of Article Views (full-text article views including HTML views, PDF and ePub downloads, according to the available data) and Abstracts Views on Vision4Press platform.
Data correspond to usage on the plateform after 2015. The current usage metrics is available 48-96 hours after online publication and is updated daily on week days.
Initial download of the metrics may take a while.