Fig. 12
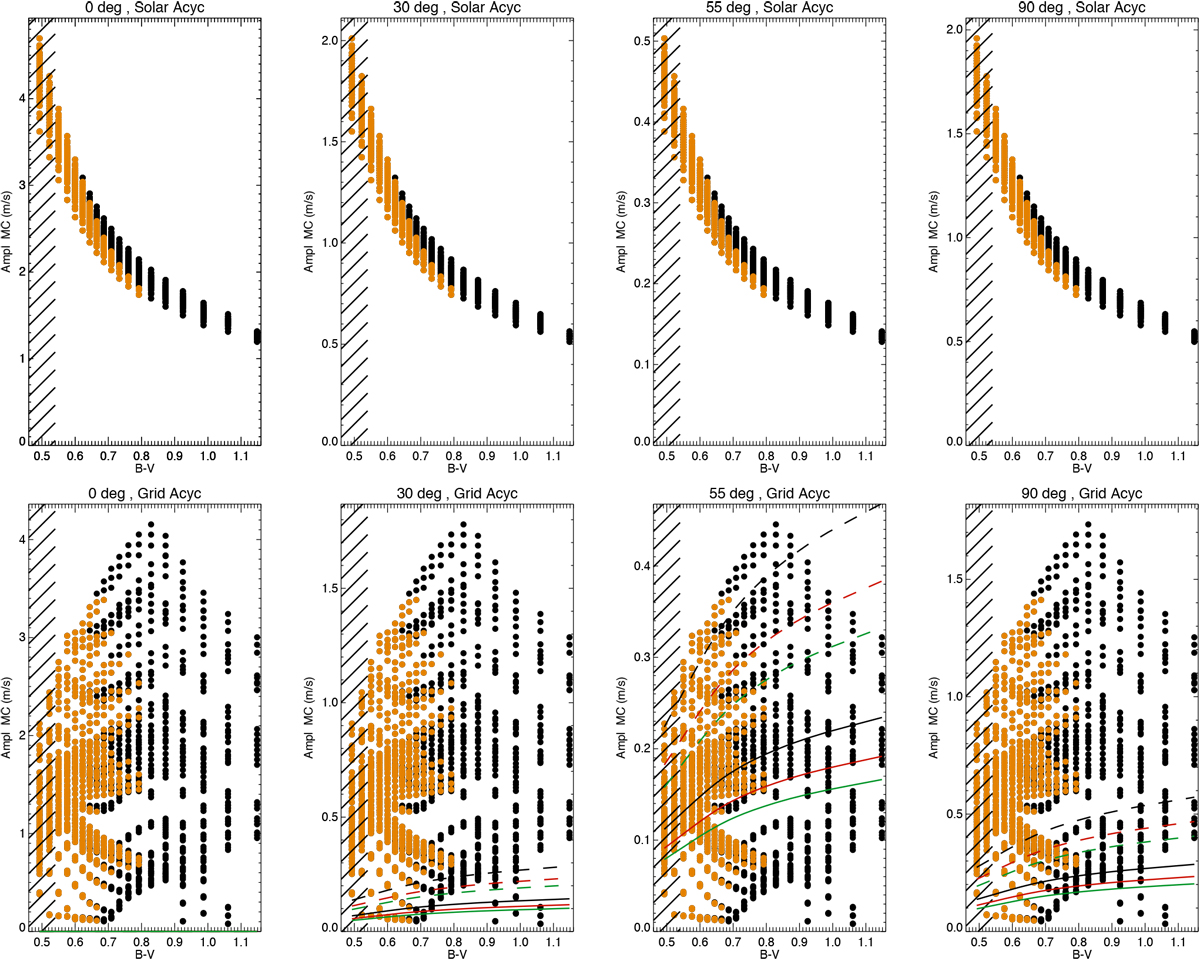
Stellar RV peak-to-peak amplitude (scaled to solar meridional flows from U10, cycle 23) vs. B–V for solar cycle 23 amplitude (upper panels) and scaled to cycle amplitude from our grid of parameters (lower panels) for four inclinations. Orange symbols represent rotation rates higher than the solar one. The black lines on the left of each panel indicate where the mass is outside the range of hydrodynamical simulation parameters. The peak-to-peak amplitude of the planetary signal, assuming the planet orbital plane is similar to the stellar equatorial plane, is shown for 1 MEarth (solid lines) and 2 MEarth (dashed lines) and for different orbital periods in the habitable zone: PHZin (black), PHZmed (red), and PHZout (green).The planetary curves for a pole-on configuration therefore follow the x-axis.
Current usage metrics show cumulative count of Article Views (full-text article views including HTML views, PDF and ePub downloads, according to the available data) and Abstracts Views on Vision4Press platform.
Data correspond to usage on the plateform after 2015. The current usage metrics is available 48-96 hours after online publication and is updated daily on week days.
Initial download of the metrics may take a while.