Fig. 10
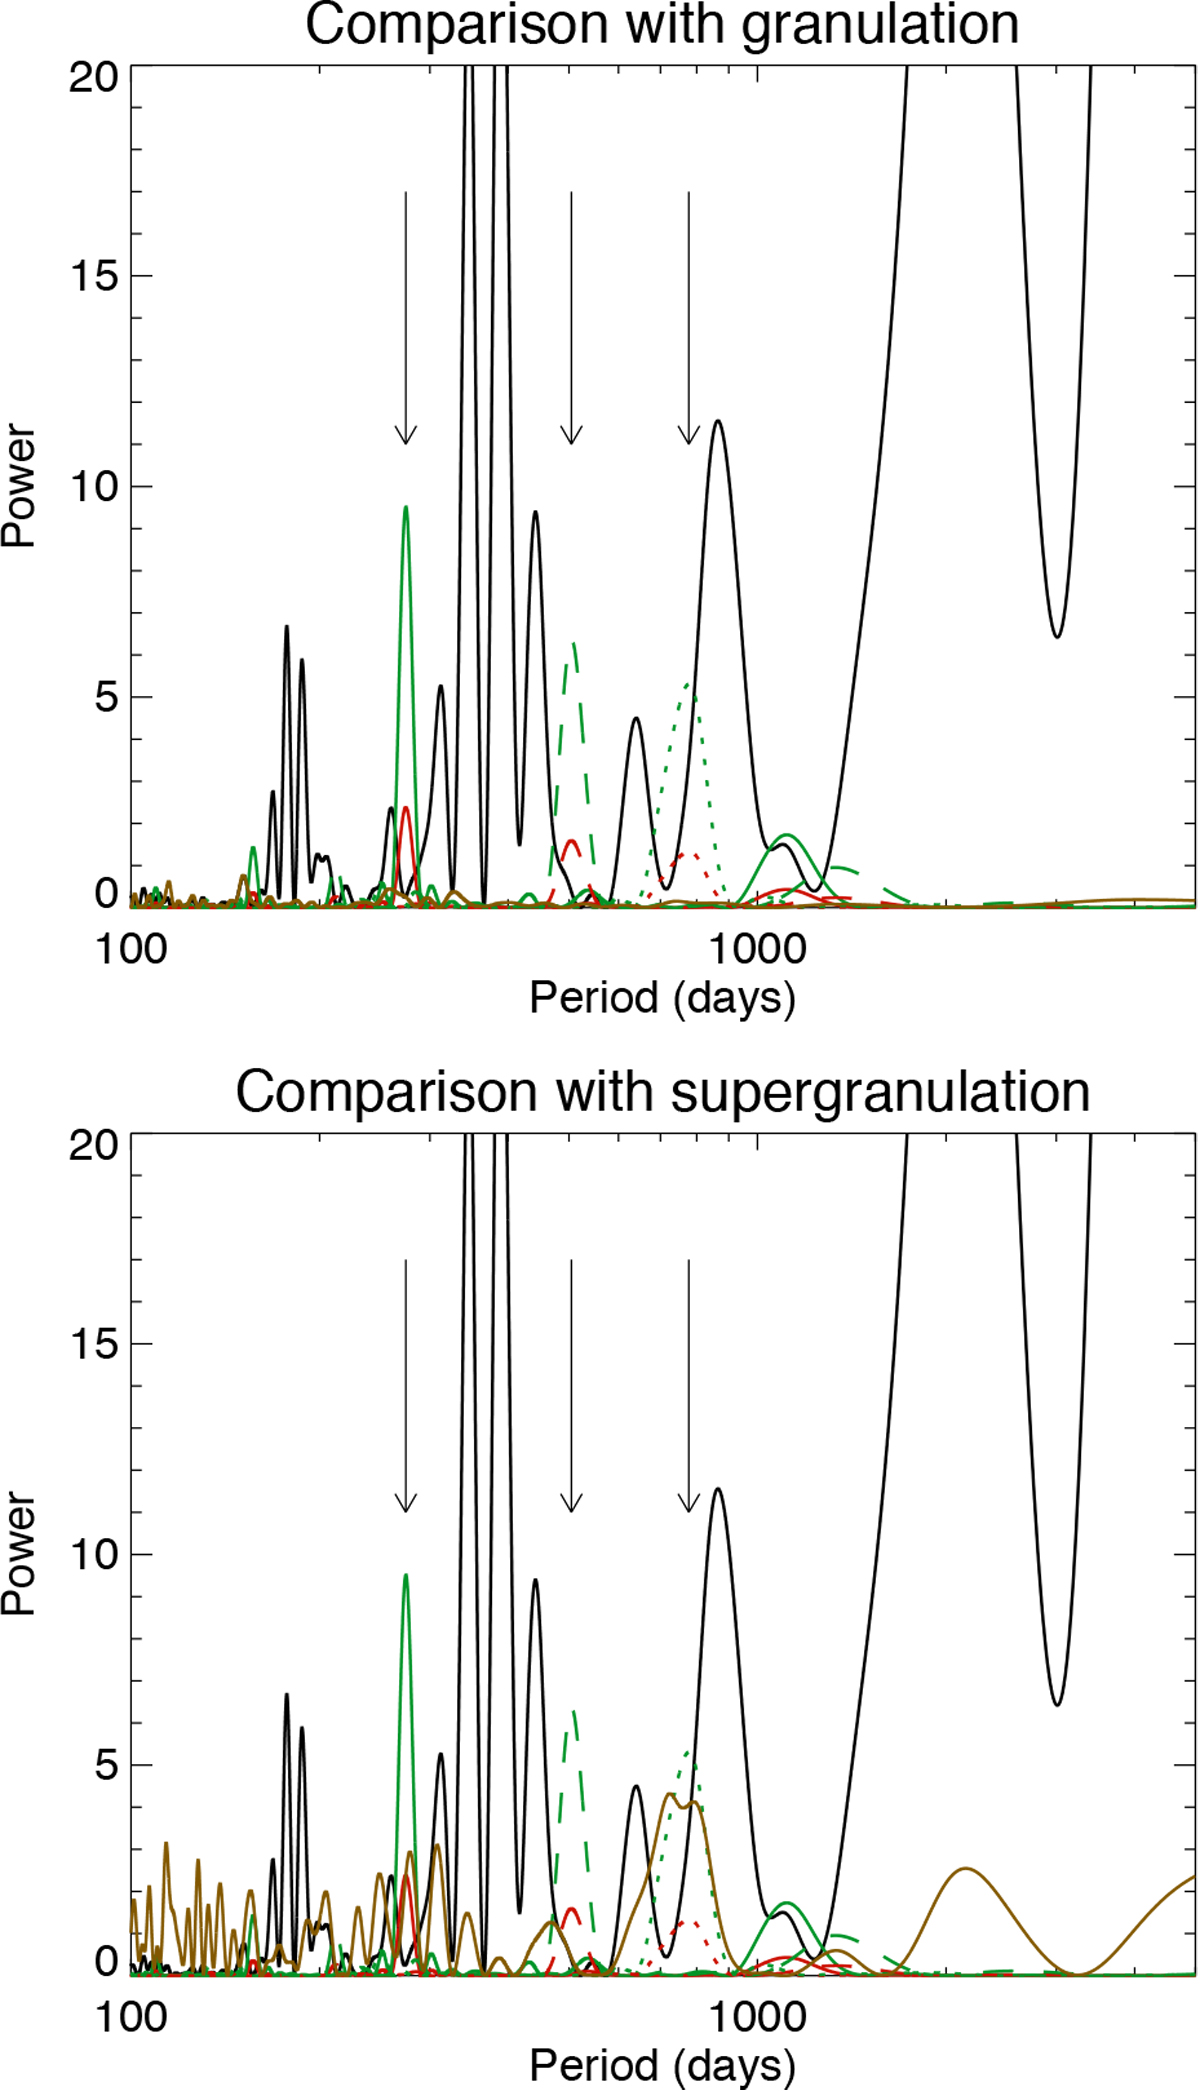
Periodograms of time series shown in the third panel of Fig. 7 (original time series and planetary RV for 1 and 2 MEarth), added to periodogram due to granulation (upper panel) and supergranulation (lower panel). The colour code for MC and planets is similar to that of Fig. 7, and the granulation and supergranulation periodograms are shown in brown.
Current usage metrics show cumulative count of Article Views (full-text article views including HTML views, PDF and ePub downloads, according to the available data) and Abstracts Views on Vision4Press platform.
Data correspond to usage on the plateform after 2015. The current usage metrics is available 48-96 hours after online publication and is updated daily on week days.
Initial download of the metrics may take a while.