Open Access
Fig. 1
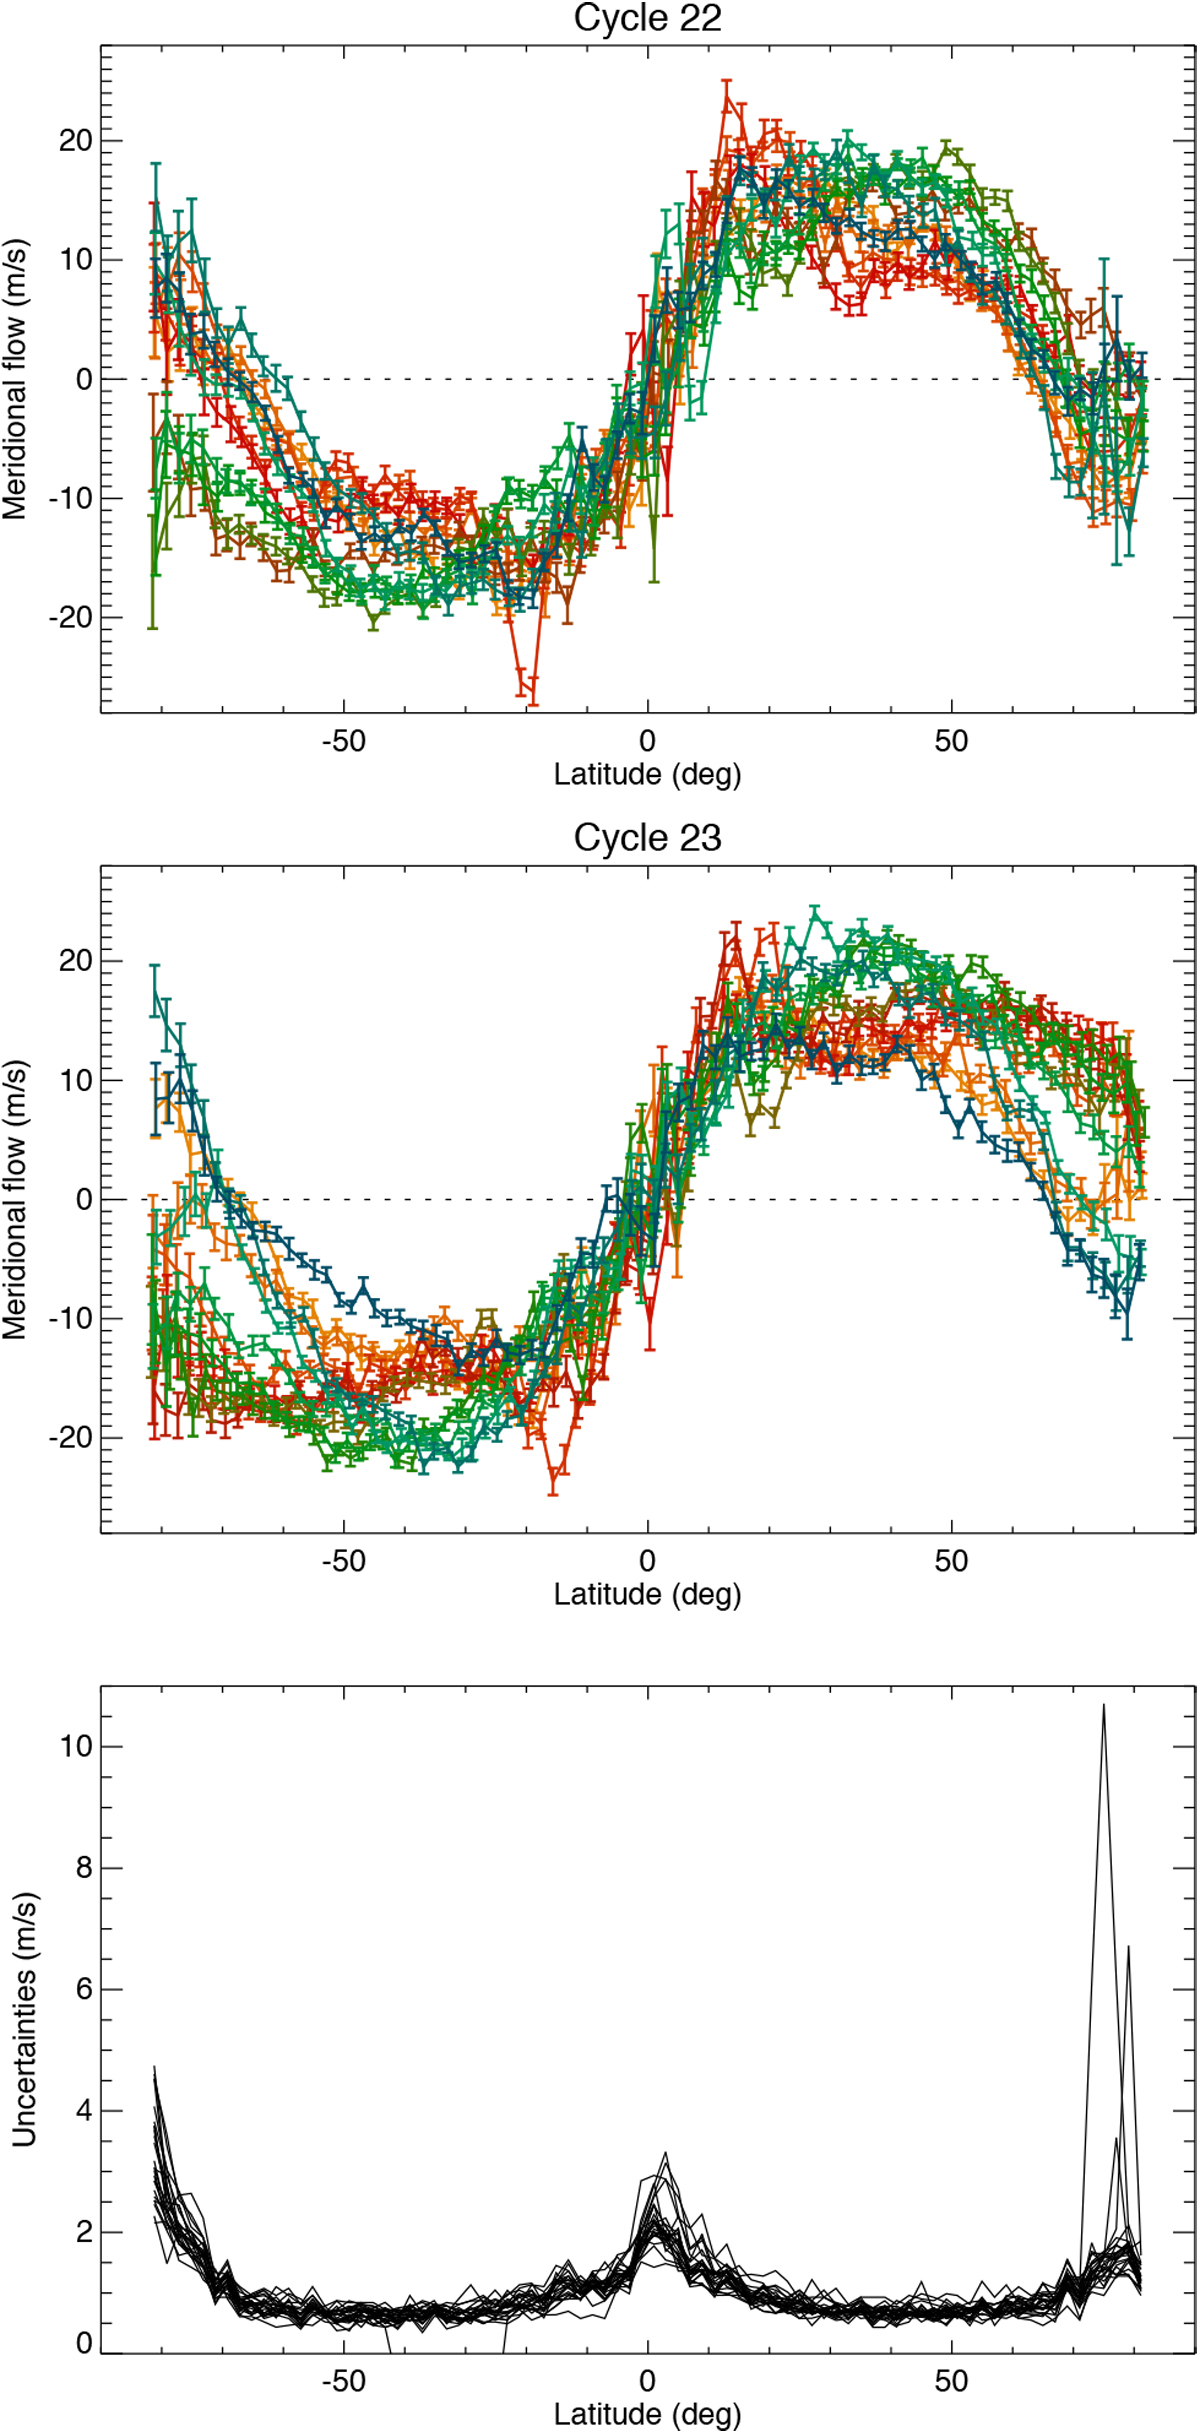
Latitudinal profiles of meridional flows from U10 for cycles 22 (upper panel) and 23 (middle panel). Positive flows are northwards. The colour code indicates time, from orange (beginning of each cycle) to blue (end of each cycle), equally spread in cycle phase. Lower panel: uncertainties vs. latitude (one curve per year).
Current usage metrics show cumulative count of Article Views (full-text article views including HTML views, PDF and ePub downloads, according to the available data) and Abstracts Views on Vision4Press platform.
Data correspond to usage on the plateform after 2015. The current usage metrics is available 48-96 hours after online publication and is updated daily on week days.
Initial download of the metrics may take a while.