Fig. 9.
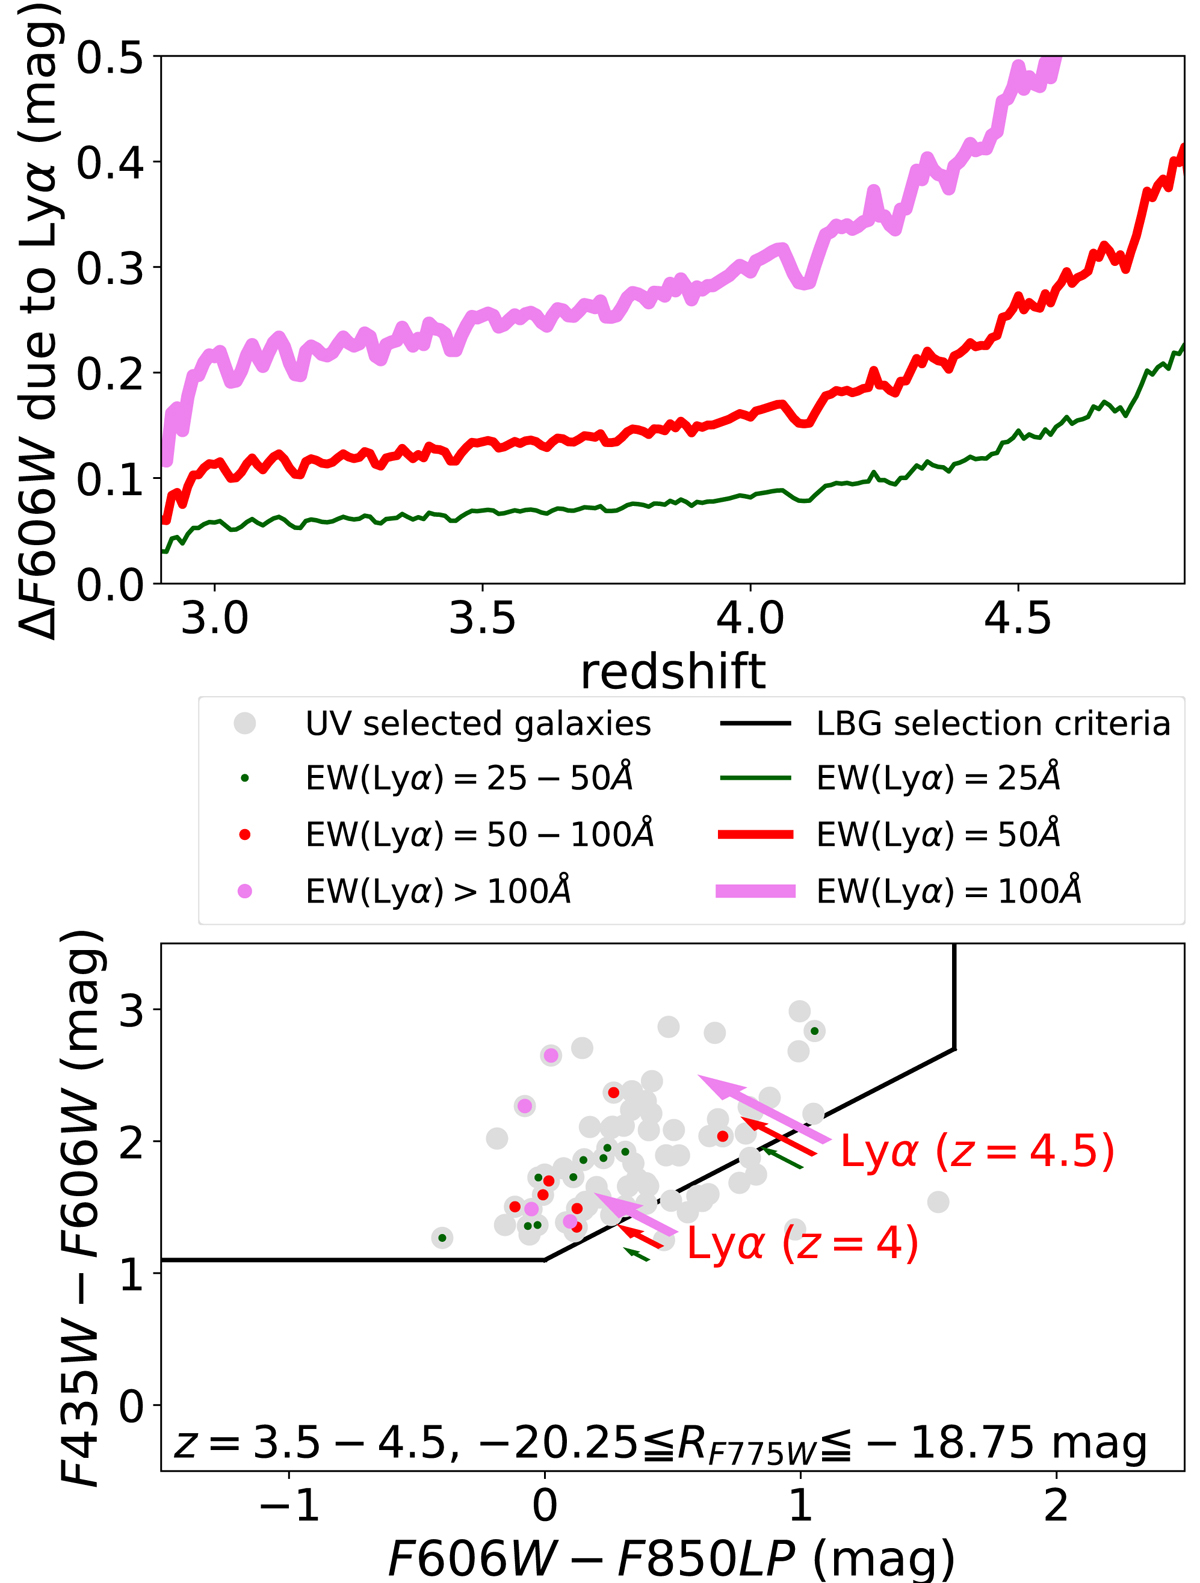
Tests of a possible LBG selection bias. Upper panel: shift of F606W magnitude due to contamination of Lyα emission as a function of redshift. Green, red, and violet lines show the shifts for EW(Lyα) = 25 Å, EW(Lyα) = 50 Å, and EW(Lyα) = 100 Å, respectively. Lower panel: color-color diagram for B (F435W)-dropouts: F435W–F606W as a function of F606W–F850LP. The grey, green, red, and violet points indicate UV selected galaxies with −20.25 ≤ M1500 ≤ −18.75 mag at zp = 3.5–4.5, those with EW(Lyα) = 20–50 Å, EW(Lyα) = 50–100 Å, and EW(Lyα) ≥ 100 Å, respectively. The black line represents the color-color criteria for B-dropout. Green, red, and violet arrows show the shifts of colors due to contamination of Lyα emission to F606W at z ≈ 4 and z ≈ 4.5 for EW(Lyα) = 25 Å, EW(Lyα) = 50 Å, and EW(Lyα) = 100 Å, respectively.
Current usage metrics show cumulative count of Article Views (full-text article views including HTML views, PDF and ePub downloads, according to the available data) and Abstracts Views on Vision4Press platform.
Data correspond to usage on the plateform after 2015. The current usage metrics is available 48-96 hours after online publication and is updated daily on week days.
Initial download of the metrics may take a while.