Fig. 4.
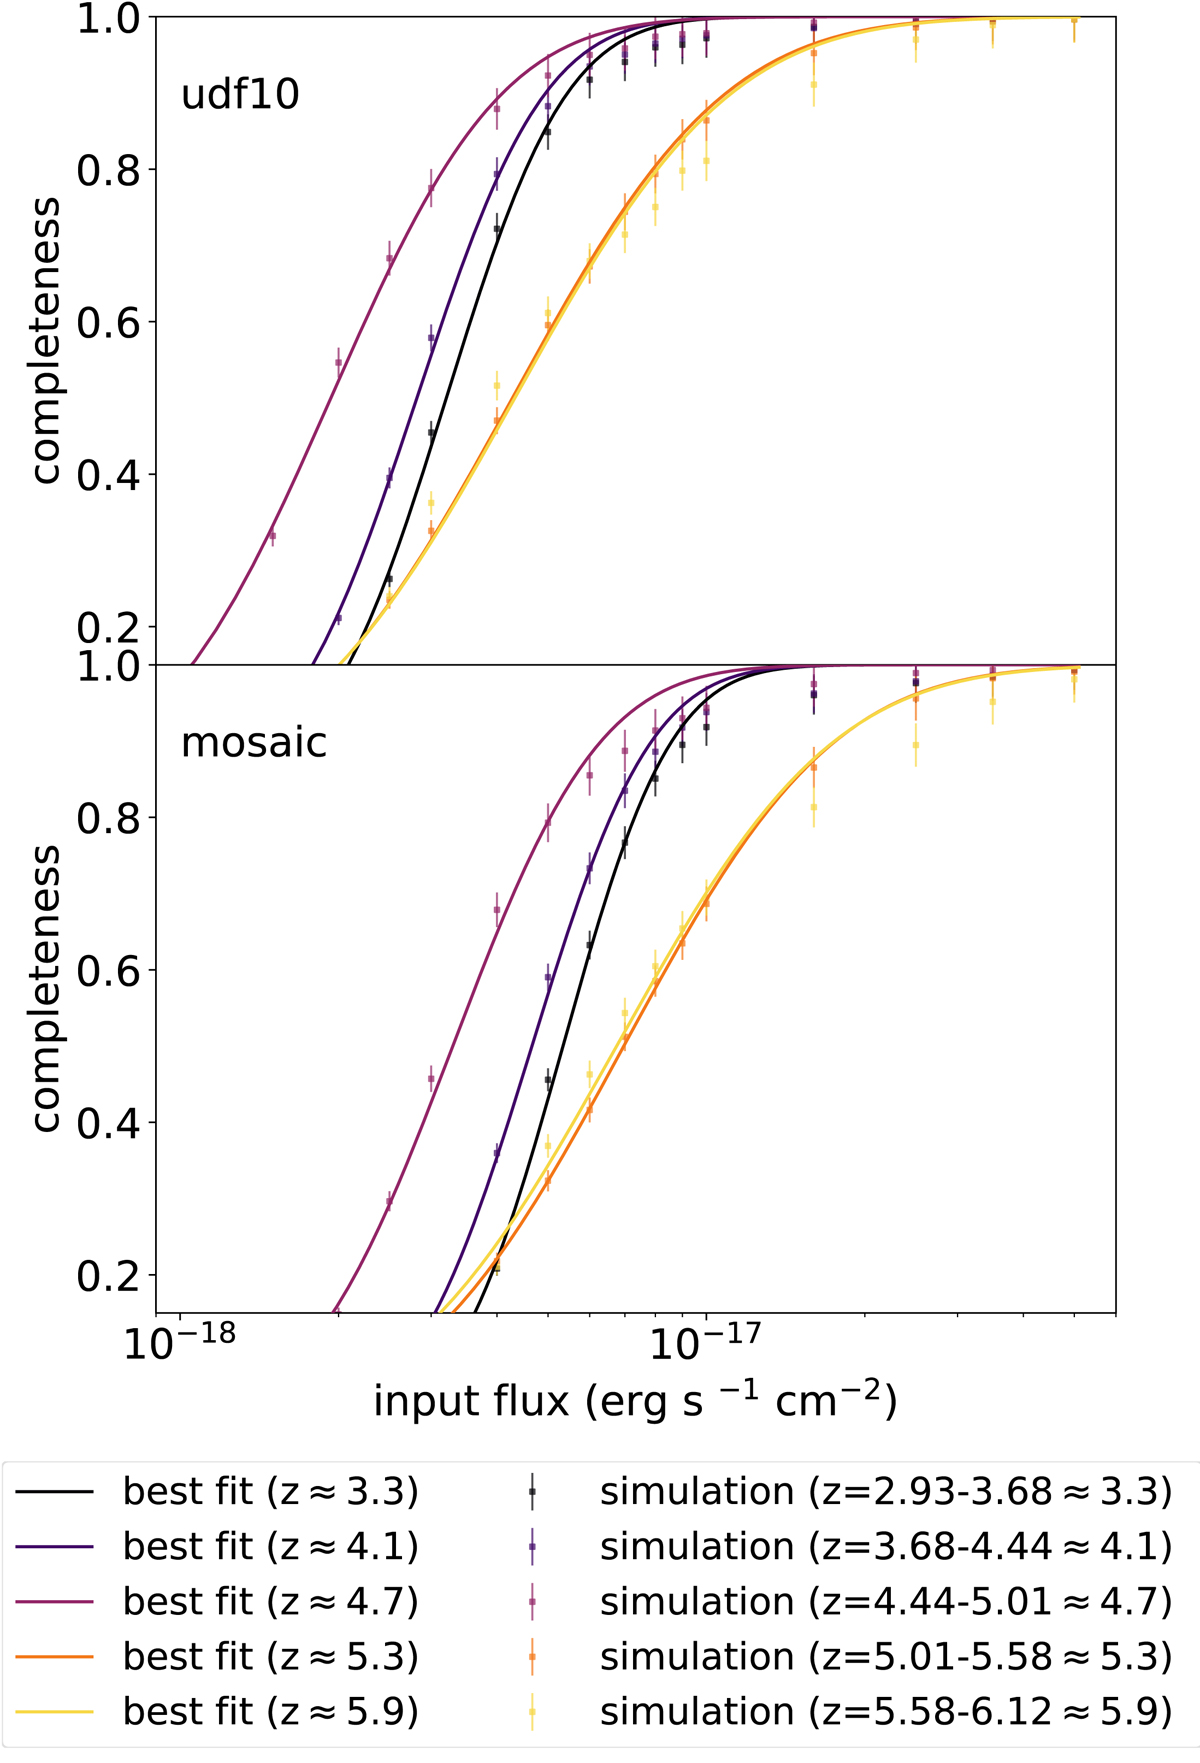
Completeness of Lyα detection as a function of Lyα flux in the udf-10 (upper panel) and mosaic (lower panel) fields. The simulated data points and their best-fit completeness functions are indicated by circles and lines, respectively. Black, purple, violet, orange and yellow colors represent redshifts z ≈ 3.3, 4.1, 4.7, 5.3, and 5.9, respectively. Error bars are calculated from the Poisson errors of the numbers of the detected fake emission lines.
Current usage metrics show cumulative count of Article Views (full-text article views including HTML views, PDF and ePub downloads, according to the available data) and Abstracts Views on Vision4Press platform.
Data correspond to usage on the plateform after 2015. The current usage metrics is available 48-96 hours after online publication and is updated daily on week days.
Initial download of the metrics may take a while.