Fig. 2.
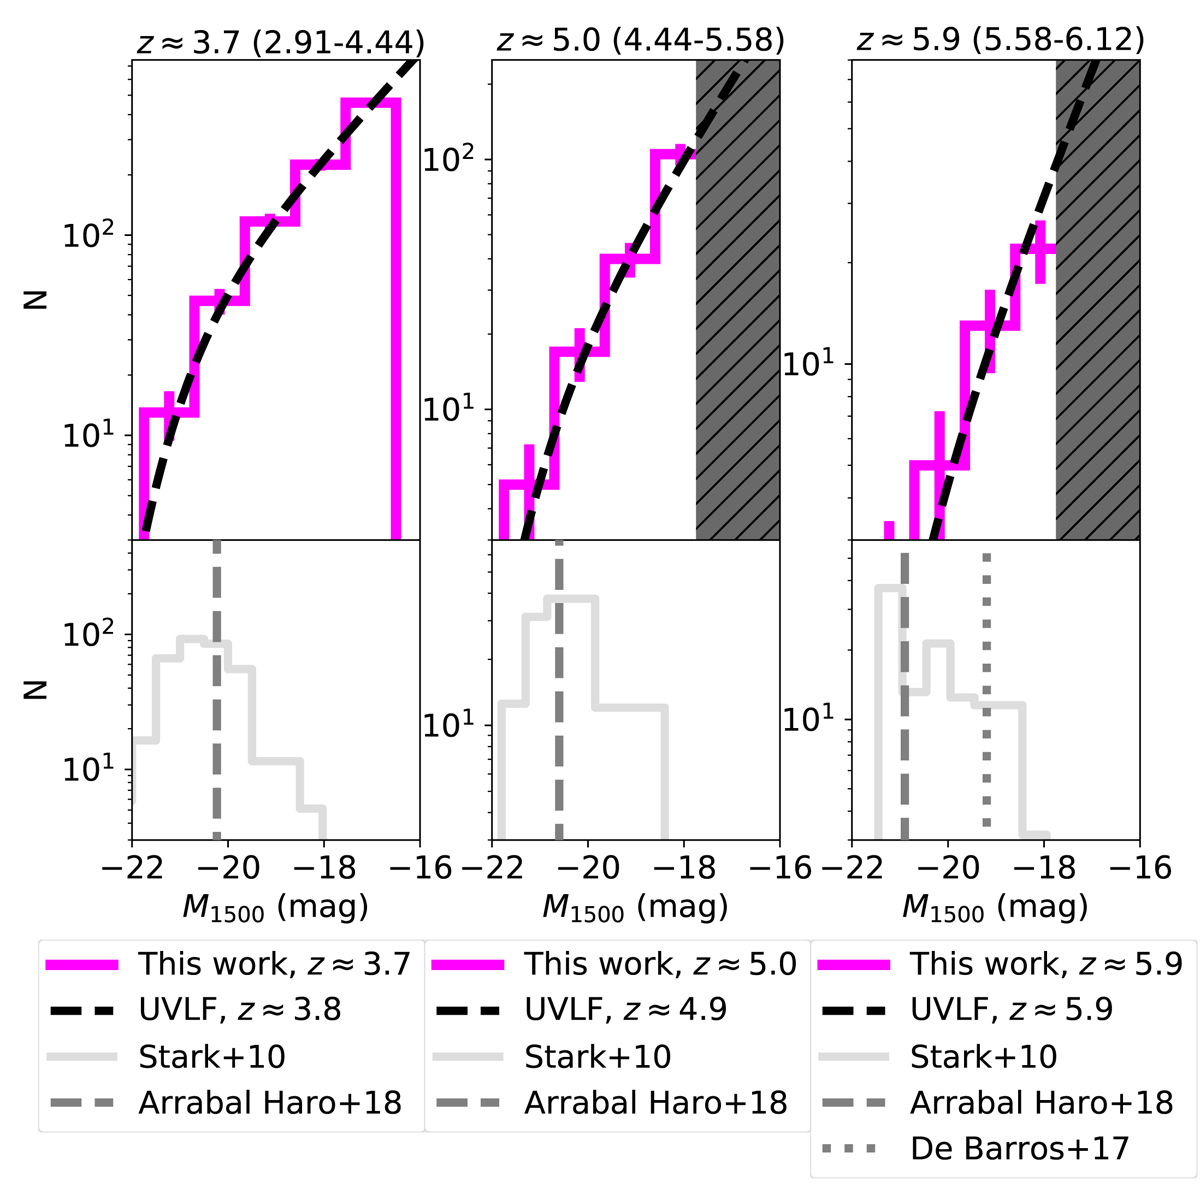
Histograms of M1500 for our parent samples at z ≈ 3.7 (= 2.91–4.44, left), 5.0 (= 4.44–5.58, middle), and 5.9 (= 5.58–6.12, right). Upper panels: magenta histograms and black dashed lines represent the number distribution of our parent sample and that expected from the UV luminosity functions (UVLF) in Bouwens et al. (2015b) for the same effective survey area, respectively. The uncertainty of the number distribution of our parent sample is given by the Poisson error. Grey hashed areas indicate M1500 ranges that are not used in this work. Lower panels: light-grey histograms shows the number distribution in Stark et al. (2010) at z ≈ 3.75, z ≈ 5.0 and z ≈ 6.0. Dark-grey dashed and dotted lines indicate the M1500 for 90% completeness at z ≈ 4, 5, and 6 in Arrabal Haro et al. (2018) and the magnitude cut at z ≈ 6 in De Barros et al. (2017), respectively.
Current usage metrics show cumulative count of Article Views (full-text article views including HTML views, PDF and ePub downloads, according to the available data) and Abstracts Views on Vision4Press platform.
Data correspond to usage on the plateform after 2015. The current usage metrics is available 48-96 hours after online publication and is updated daily on week days.
Initial download of the metrics may take a while.