Free Access
Fig. F.1.
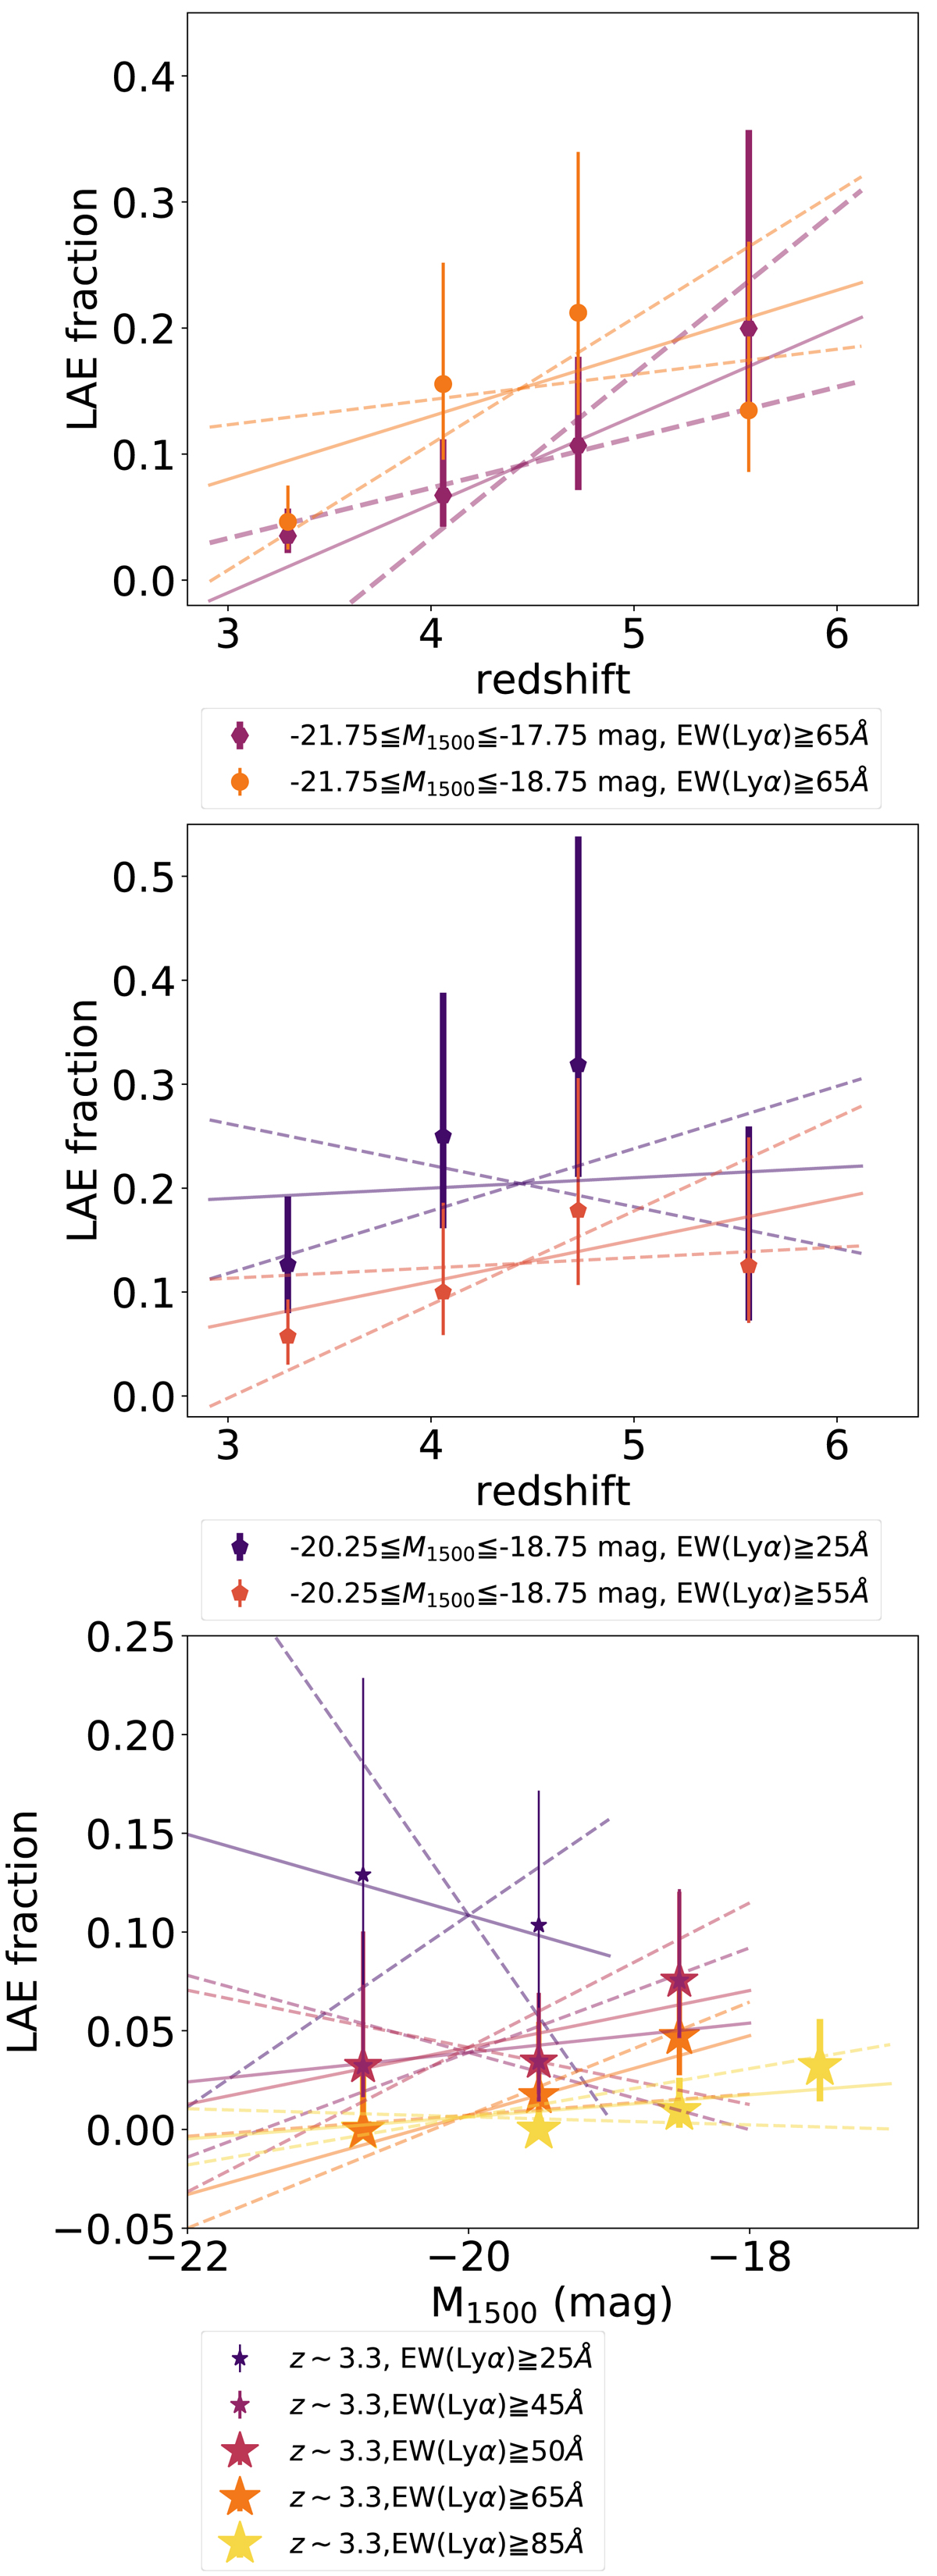
Slopes of the best-fit linear relations of of XLAE as a function of z (top and middle panels) and M1500 (bottom panel). Symbols are the same as those in Figs. 7–6. The best-fit linear relations and the ±1σ slopes are shown by the solid and dashed lines, respectively, with lighter colors of those for the symbols.
Current usage metrics show cumulative count of Article Views (full-text article views including HTML views, PDF and ePub downloads, according to the available data) and Abstracts Views on Vision4Press platform.
Data correspond to usage on the plateform after 2015. The current usage metrics is available 48-96 hours after online publication and is updated daily on week days.
Initial download of the metrics may take a while.