Fig. D.1.
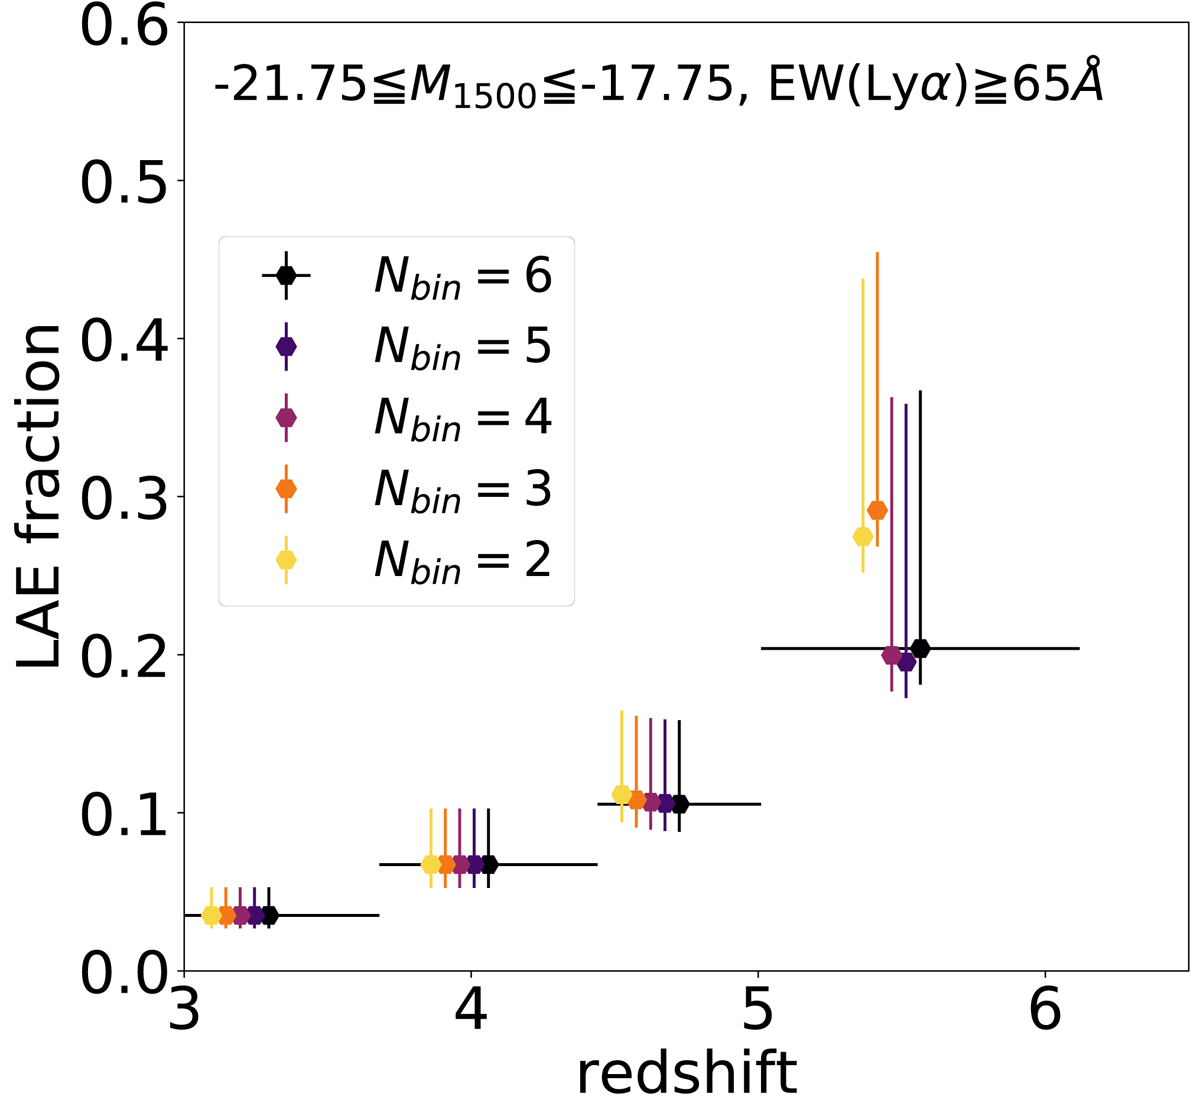
Test for the effect of binning of Lyα flux to correct incompleteness of the number of LAEs. The median values and error bars of XLAE for the plot of the evolution of XLAE (Fig. 7) are shown. The black, purple, violet, orange, and yellow hexagons indicate Nbin = 6, 5, 4, 3, and 2, respectively. For visualization purposes, we slightly shift the points along the x-axis and show the width of z only for Nbin = 6.
Current usage metrics show cumulative count of Article Views (full-text article views including HTML views, PDF and ePub downloads, according to the available data) and Abstracts Views on Vision4Press platform.
Data correspond to usage on the plateform after 2015. The current usage metrics is available 48-96 hours after online publication and is updated daily on week days.
Initial download of the metrics may take a while.