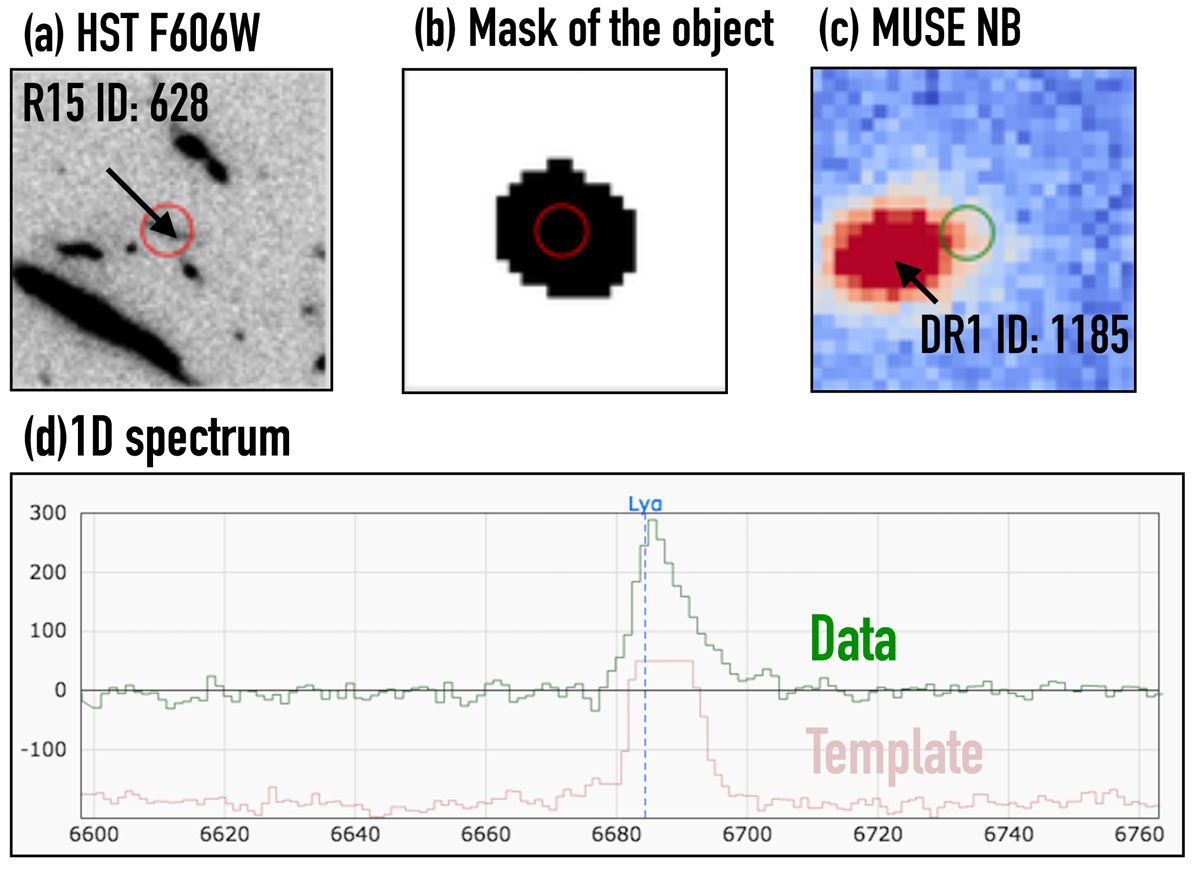
Fig. C.1.

Example of contamination of Lyα emission from a neighboring object. Panels a–d: sub-panels in MARZ’s screen (Inami et al. 2017) for a UV-selected source with Rafelski et al. (2015) ID = 628: (a) HST F606W cutout, (b) mask of the object for the extraction of the 1D spectrum, (c) MUSE NB cutout, and (d) 1D spectrum. The red and green circle in the images show the position of the UV-selected galaxy. The green and red lines in panel d indicate observational data and the best-fit template.
Current usage metrics show cumulative count of Article Views (full-text article views including HTML views, PDF and ePub downloads, according to the available data) and Abstracts Views on Vision4Press platform.
Data correspond to usage on the plateform after 2015. The current usage metrics is available 48-96 hours after online publication and is updated daily on week days.
Initial download of the metrics may take a while.


