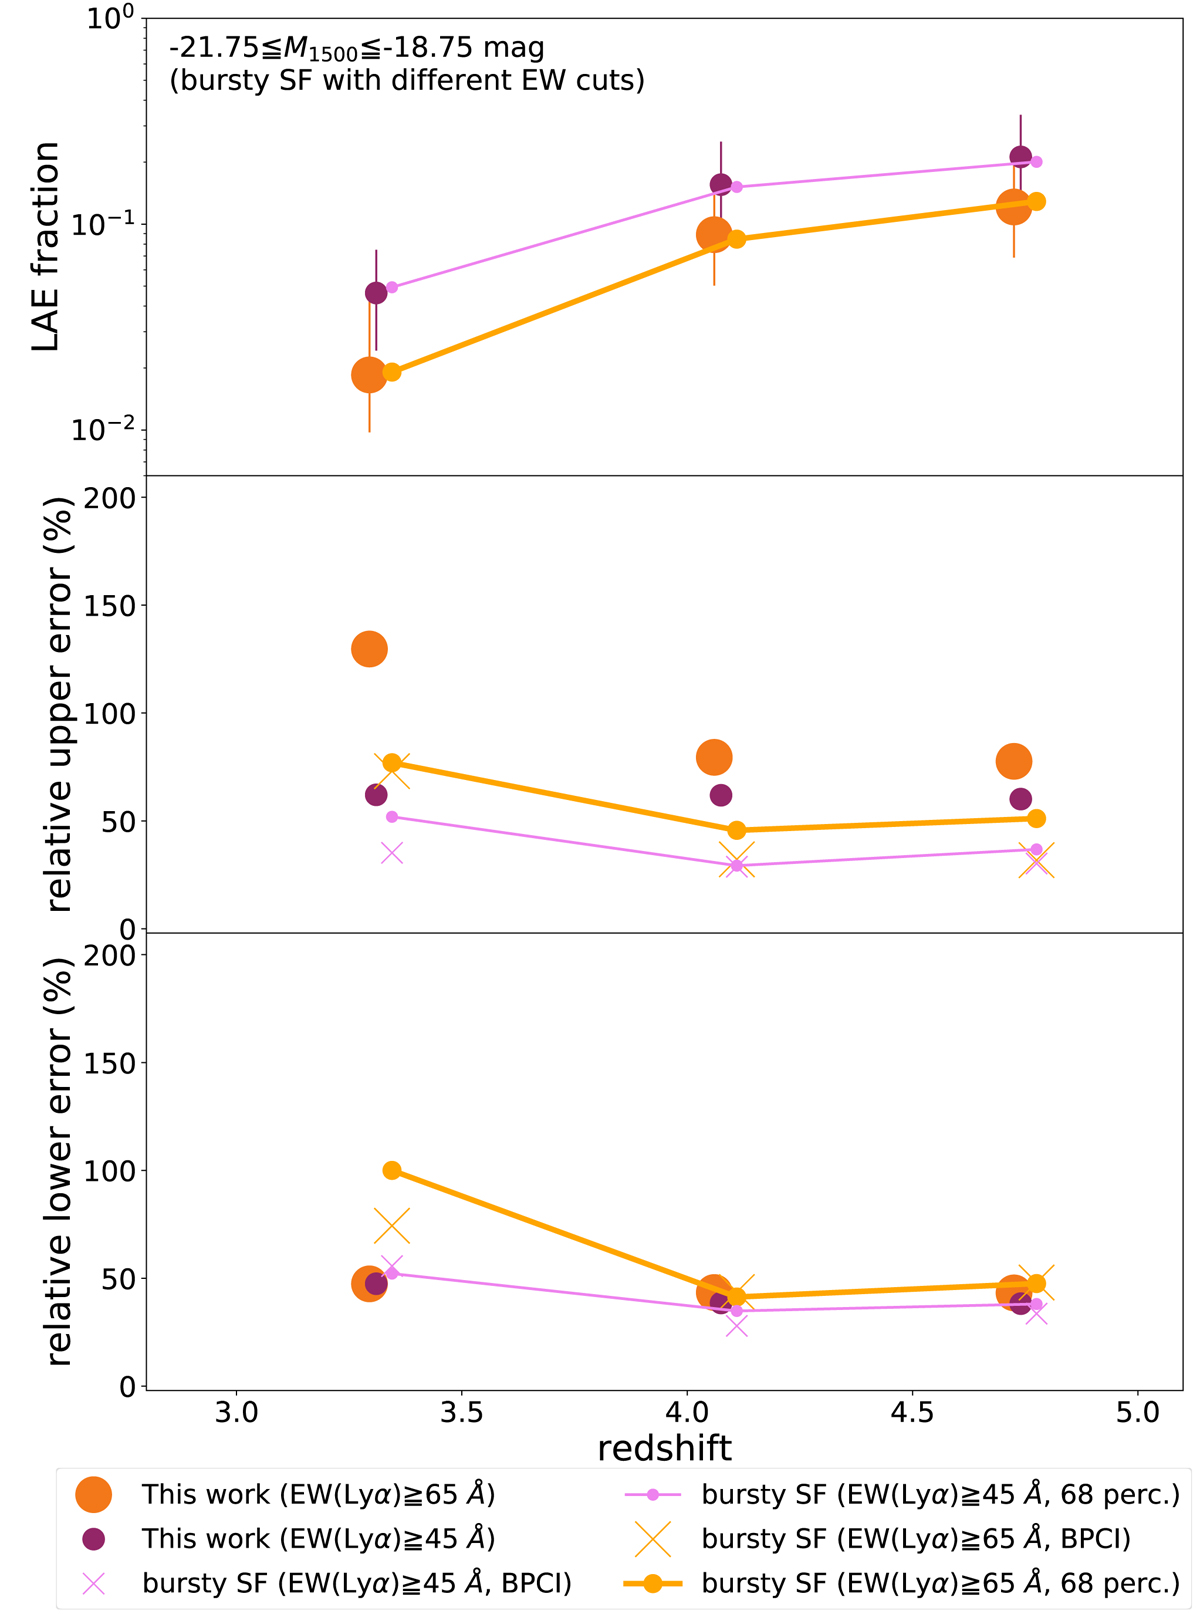
Fig. 12.

Test of cosmic variance and uncertainties of XLAE for our MUSE observations using GALICS mocks of the bursty SF model. Top panel: XLAE vs. z for M1500 ∈ [ − 21.75; −18.75], at z < 5. In order to better compare GALICS with our observations and to provide a more accurate estimate of cosmic variance, we use slightly different EW cuts for the model. We replace the 45 Å cut with 46 Å, 48 Å, and 46 Å cuts at z ≈ 3.3, 4.1, and 4.7, and we replace the 65 Å cut with 53 Å, 52 Å, and 49 Å at the same redshifts. With these cuts, the values of XLAE from MUSE (violet and orange circles at for EW(Lyα) ≥ 45 Å and EW(Lyα) ≥ 65 Å) and GALICS (solid lines) match. Middle panel: relative upper 1σ uncertainties of XLAE vs. z for M1500 ∈ [ − 21.75; −18.75], at z < 5. The relative 68% percentiles of XLAE (field-to-field variance) measured among 100 GALICS mocks are indicated by violet and orange circles with soloid lines for EW(Lyα) ≥ 45 Å and EW(Lyα) ≥ 65 Å, respectively. The 68% percentile includes both of the cosmic variance and statistical error. The statistical errors estimated from BPCI are shown by violet and orange crosses. The MUSE uncertainties (estimated from BPCI including completeness correction effects) for EW(Lyα) ≥ 45 Å and EW(Lyα) ≥ 65 Å are indicated by violet and orange circles, respectively. Bottom panel: relative lower 1σ uncertainties of XLAE vs. z for M1500 ∈ [ − 21.75; −18.75], at z < 5. The symbols are the same as those in the middle panel. For visualization purposes, we slightly shift the points along the x-axis.
Current usage metrics show cumulative count of Article Views (full-text article views including HTML views, PDF and ePub downloads, according to the available data) and Abstracts Views on Vision4Press platform.
Data correspond to usage on the plateform after 2015. The current usage metrics is available 48-96 hours after online publication and is updated daily on week days.
Initial download of the metrics may take a while.


