Fig. 11.
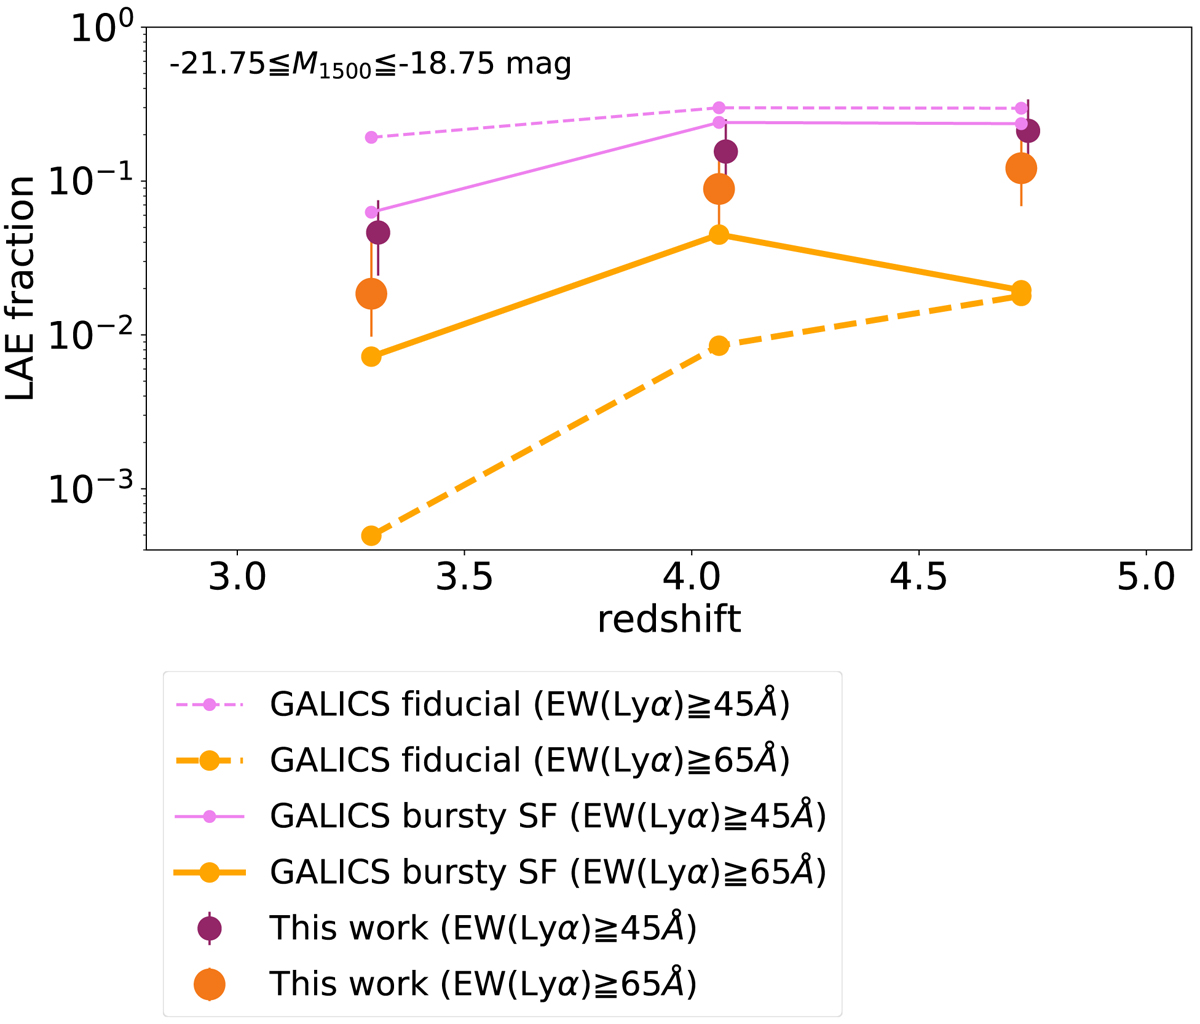
XLAE vs. z for M1500 ∈ [ − 21.75; −18.75], at z < 5, from our MUSE results compared to predictions from the GALICS model. The MUSE results for EW(Lyα) ≥ 45 Å and EW(Lyα) ≥ 65 Å are indicated by violet and orange circles, respectively. The magenta and orange dashed (solid) lines with dots show the average XLAE computed from 100 mocks of the fiducial (bursty SF) GALICS model (Garel et al. 2015) for EW(Lyα) ≥ 45 Å and EW(Lyα) ≥ 65 Å, respectively. For visualization purposes, we slightly shift the points along the x-axis.
Current usage metrics show cumulative count of Article Views (full-text article views including HTML views, PDF and ePub downloads, according to the available data) and Abstracts Views on Vision4Press platform.
Data correspond to usage on the plateform after 2015. The current usage metrics is available 48-96 hours after online publication and is updated daily on week days.
Initial download of the metrics may take a while.