Fig. 9.
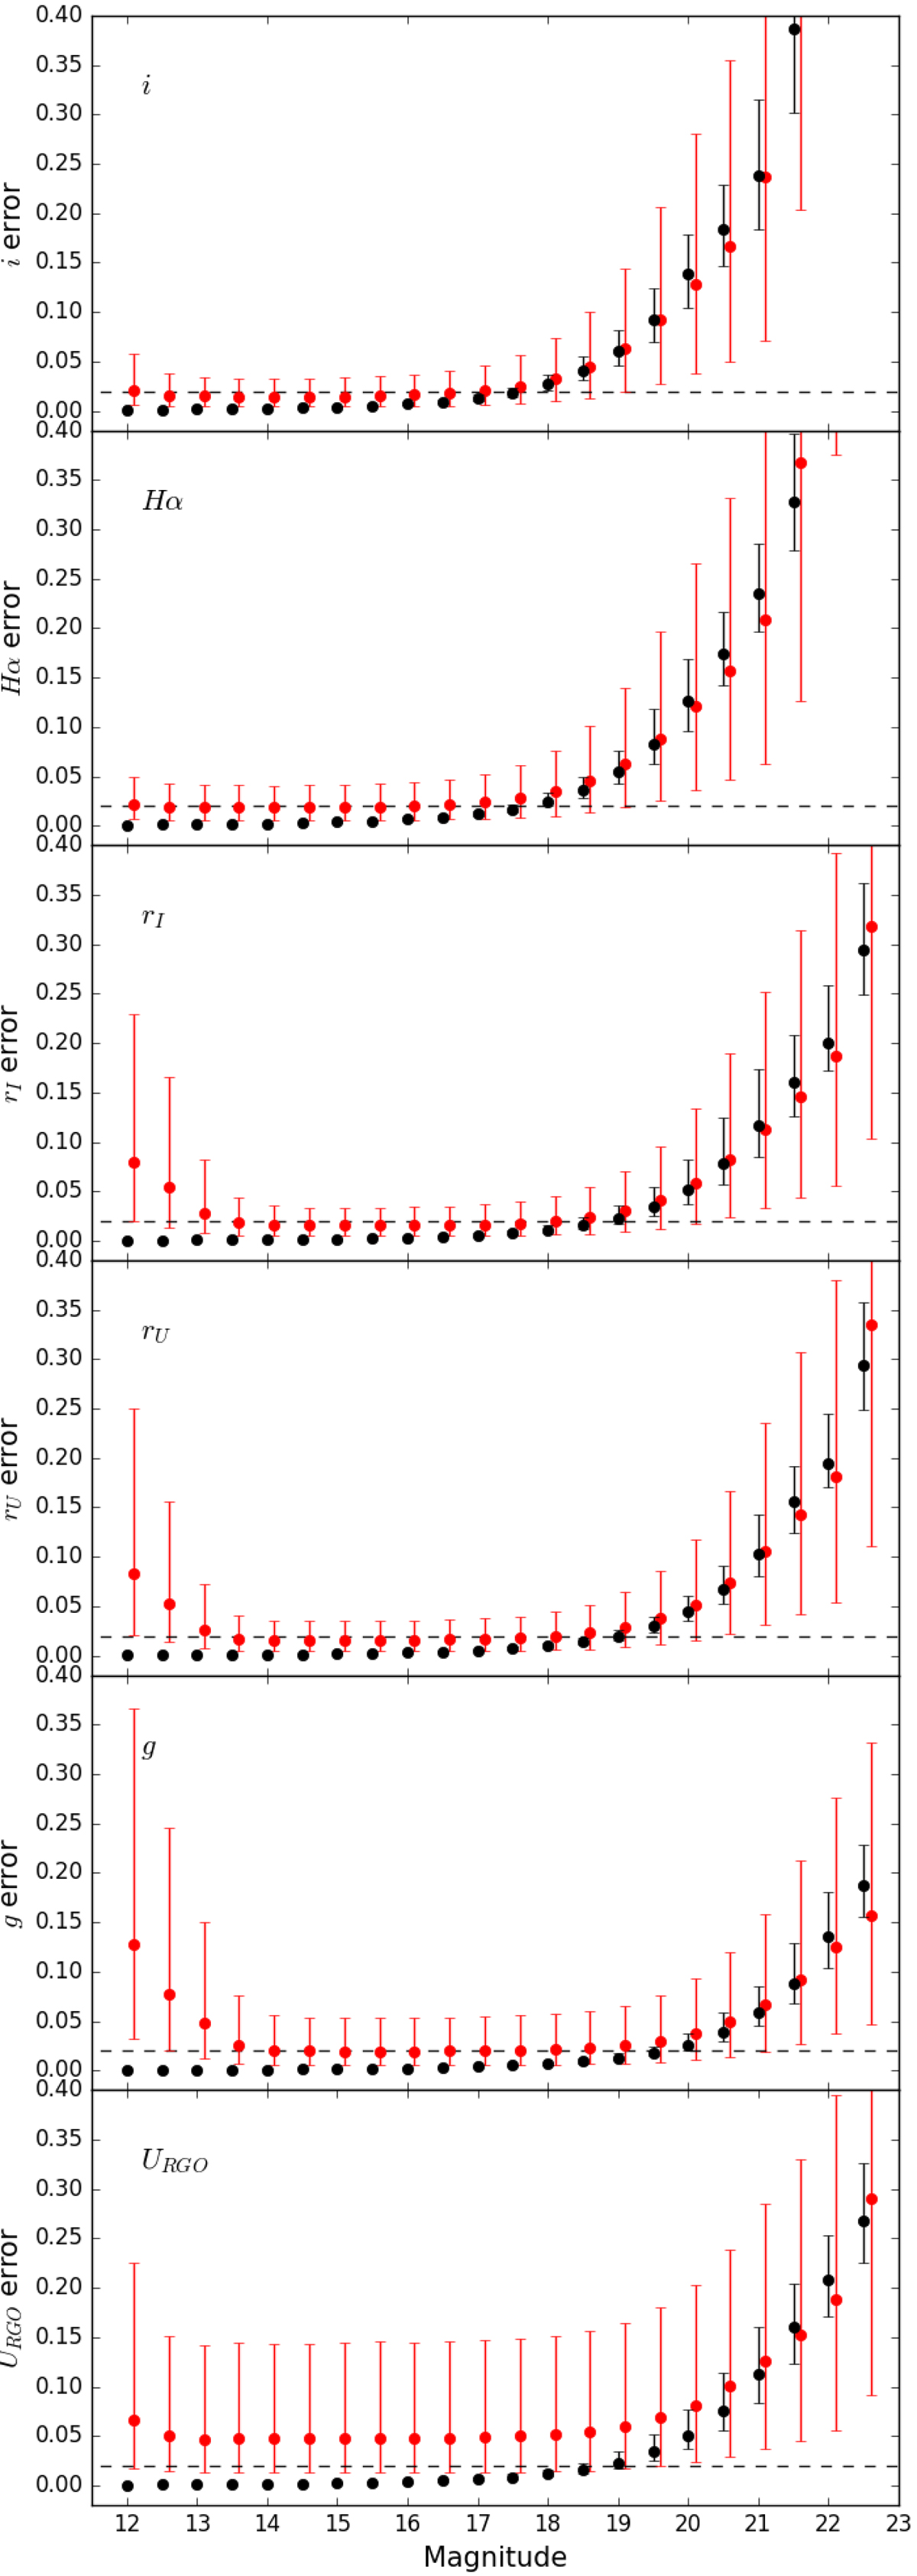
In black, median photometric errors for 0.5 mag bins for each of the six bands. Error bars indicate the 16 and 84 percentiles, mimicking 1σ error bars. In red we show the median differences between the primary and the secondary detections for each bin, with error bars indicating also their 16 and 84 percentiles. Red points are shifted 0.1 mag to separate them from the black dots to make them visible. The dashed horizontal line marks a 0.02 mag error level.
Current usage metrics show cumulative count of Article Views (full-text article views including HTML views, PDF and ePub downloads, according to the available data) and Abstracts Views on Vision4Press platform.
Data correspond to usage on the plateform after 2015. The current usage metrics is available 48-96 hours after online publication and is updated daily on week days.
Initial download of the metrics may take a while.