Fig. B.1.
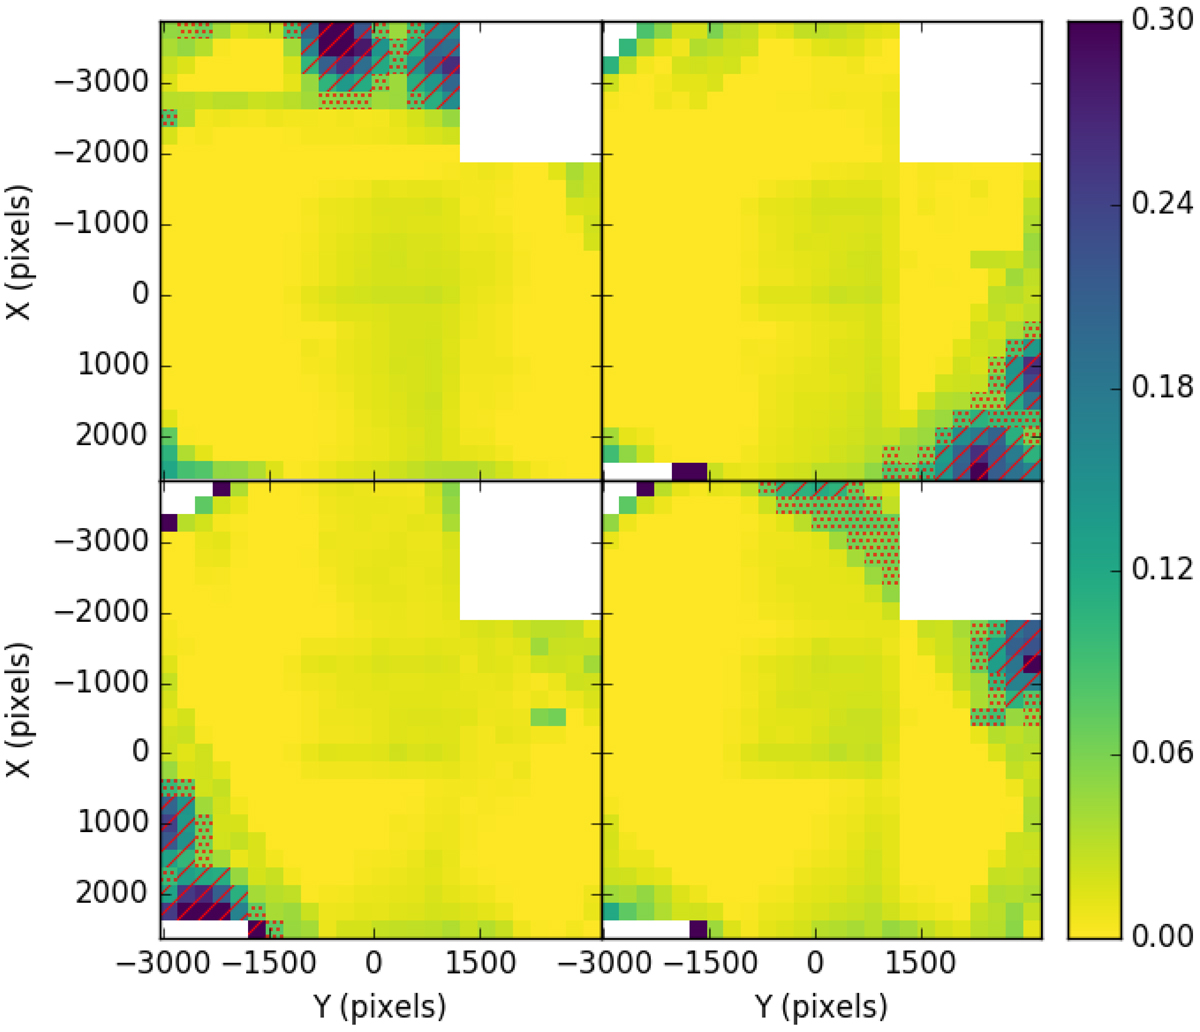
Differences between Pan-STARRS and IGAPS g magnitudes as a function of position in the WFC image plane. Median values are plotted for each 250 × 250 pixel2 bin. The mask applied for observations made within four different phases of UVEX data collection are shown. The diagonal hatched regions represent the placement of the inner g-band mask, while the dotted regions indicate the outer mask. Top-left: mask used for observations before June 2006. Top-right: mask for observations between June 2006 and December 2013. Bottom-left: mask for observations between December 2013 and March 2017. Bottom-right: mask for observations after March 2017.
Current usage metrics show cumulative count of Article Views (full-text article views including HTML views, PDF and ePub downloads, according to the available data) and Abstracts Views on Vision4Press platform.
Data correspond to usage on the plateform after 2015. The current usage metrics is available 48-96 hours after online publication and is updated daily on week days.
Initial download of the metrics may take a while.