Fig. 21.
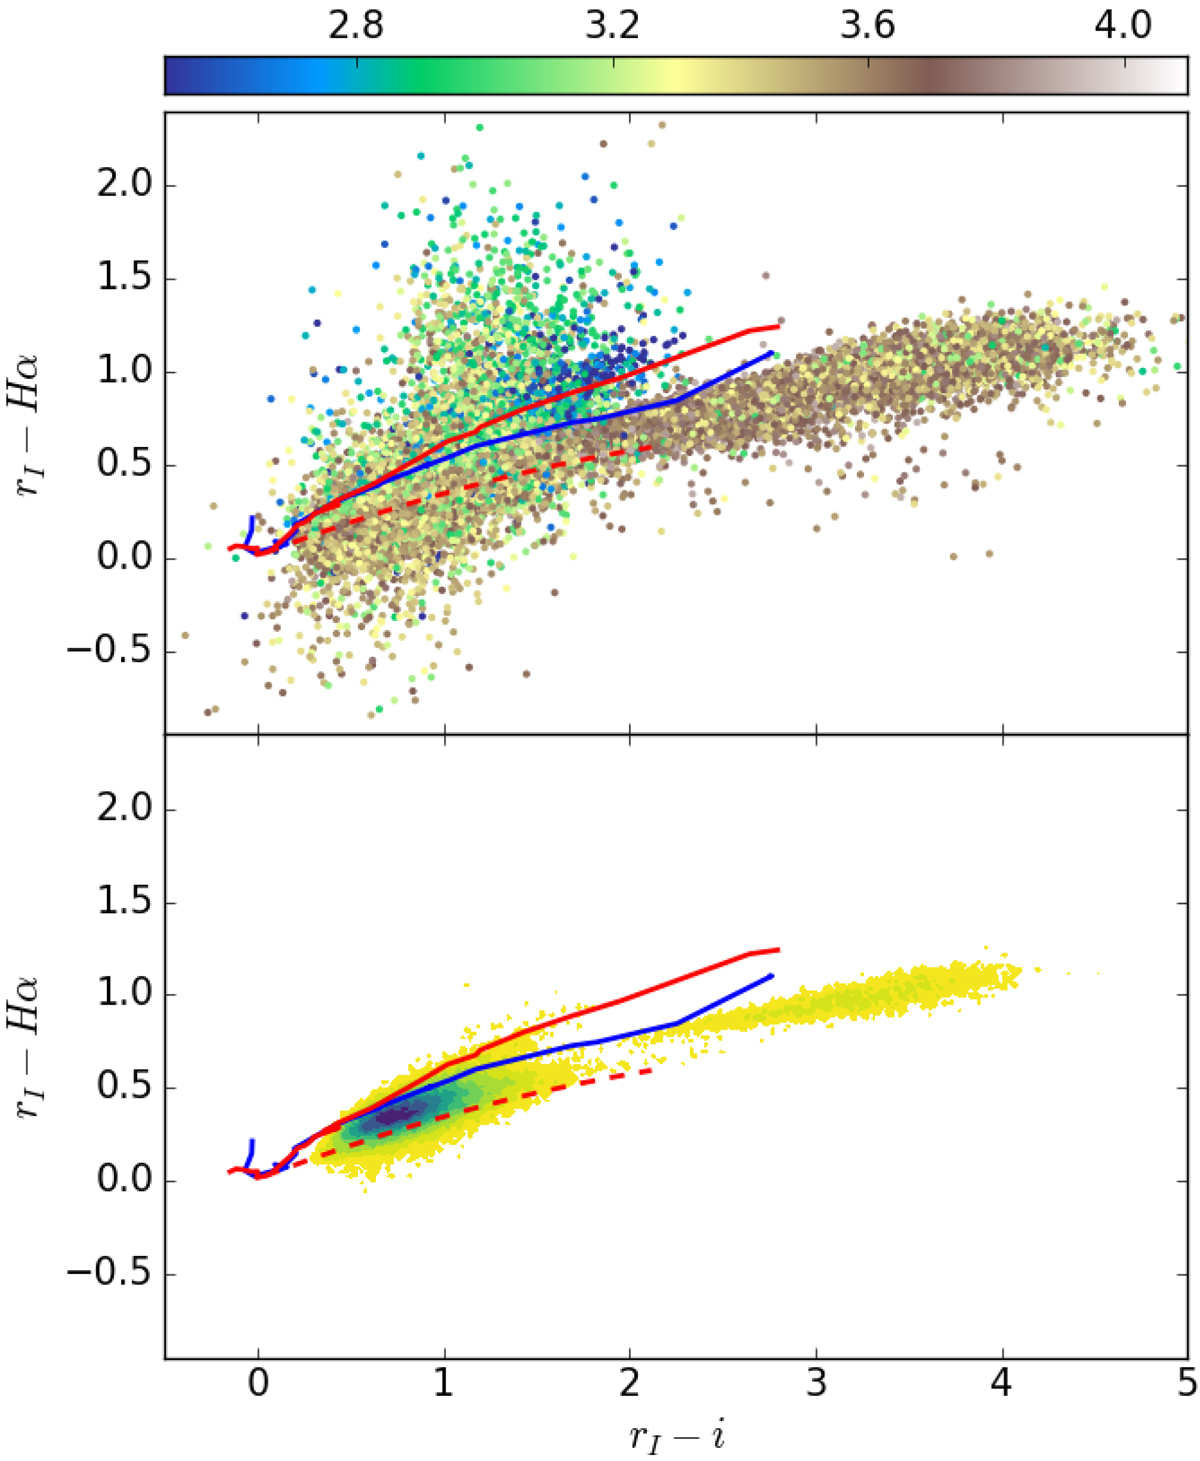
rI − Hα vs. rI − i two-colour diagram for variable sources. The stars in the upper panel are coloured according to the logarithm of the distance from Gaia DR2 (Bailer-Jones et al. 2018). The solid red line is the unreddened MS, while the dashed red line is the reddening line for an A2V star up to AV = 10. The blue line is the unreddened sequence for the giants. Lower panel: density plot of the stars identified as variables. Evidently, the great majority are located in the main stellar locus at rI − i ≲ 1. The other notable feature is the “island” of relatively extreme red giants beginning at rI − i ∼ 2.5.
Current usage metrics show cumulative count of Article Views (full-text article views including HTML views, PDF and ePub downloads, according to the available data) and Abstracts Views on Vision4Press platform.
Data correspond to usage on the plateform after 2015. The current usage metrics is available 48-96 hours after online publication and is updated daily on week days.
Initial download of the metrics may take a while.