Fig. 17.
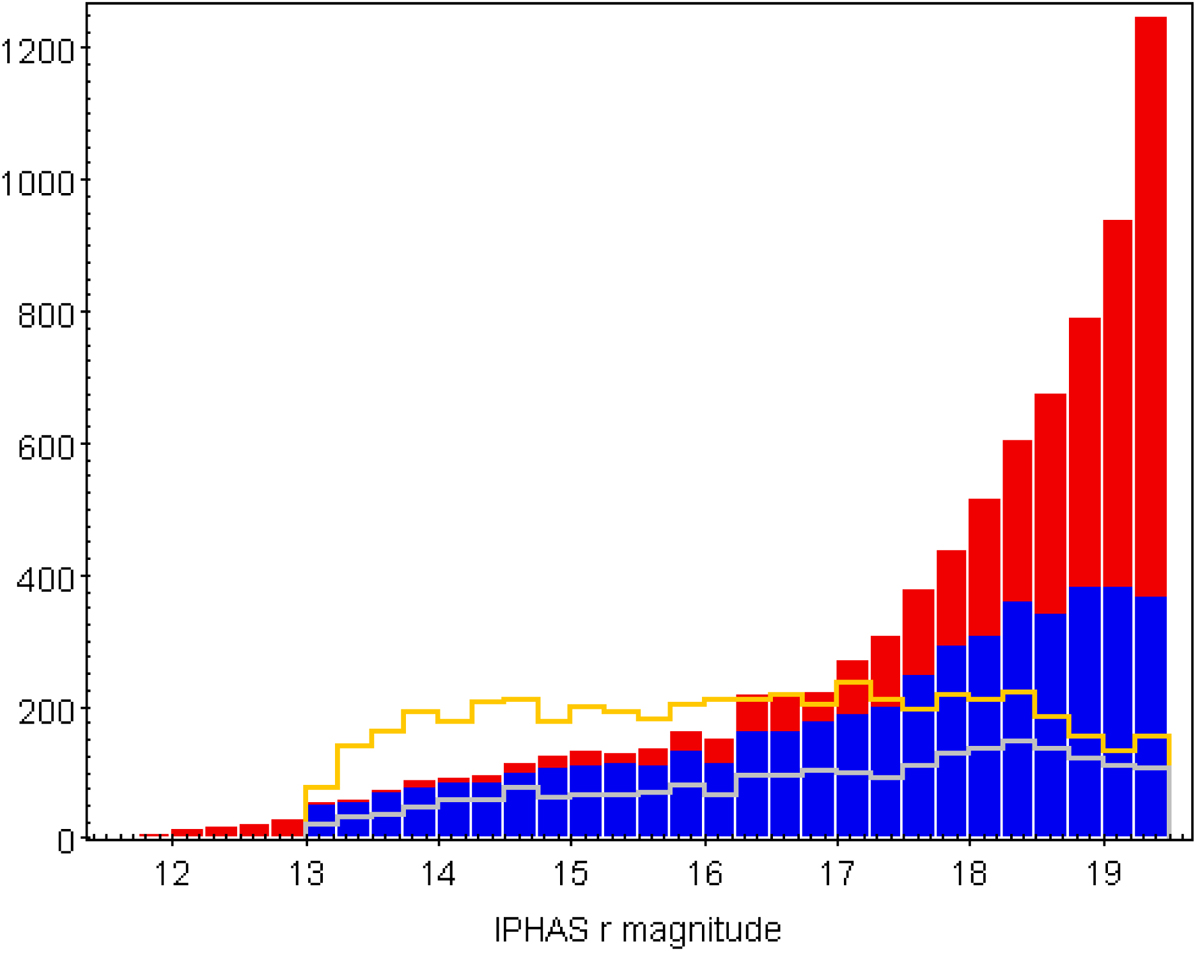
Comparison between the r magnitude distributions of > 5σ candidate emission-line stars identified in the IGAPS catalogue and the W08 list. The red filled histogram refers to the full IGAPS list, while the superimposed blue filled histogram is limited to objects meeting the same morphology-class criteria imposed by W08. The yellow unfilled histogram represents the full W08 list. The light grey unfilled histogram shows the union of the full W08 list with the IGAPS list (blue histogram), when restricted to candidate emitters meeting W08’s class criteria and bright limit.
Current usage metrics show cumulative count of Article Views (full-text article views including HTML views, PDF and ePub downloads, according to the available data) and Abstracts Views on Vision4Press platform.
Data correspond to usage on the plateform after 2015. The current usage metrics is available 48-96 hours after online publication and is updated daily on week days.
Initial download of the metrics may take a while.