Fig. 15.
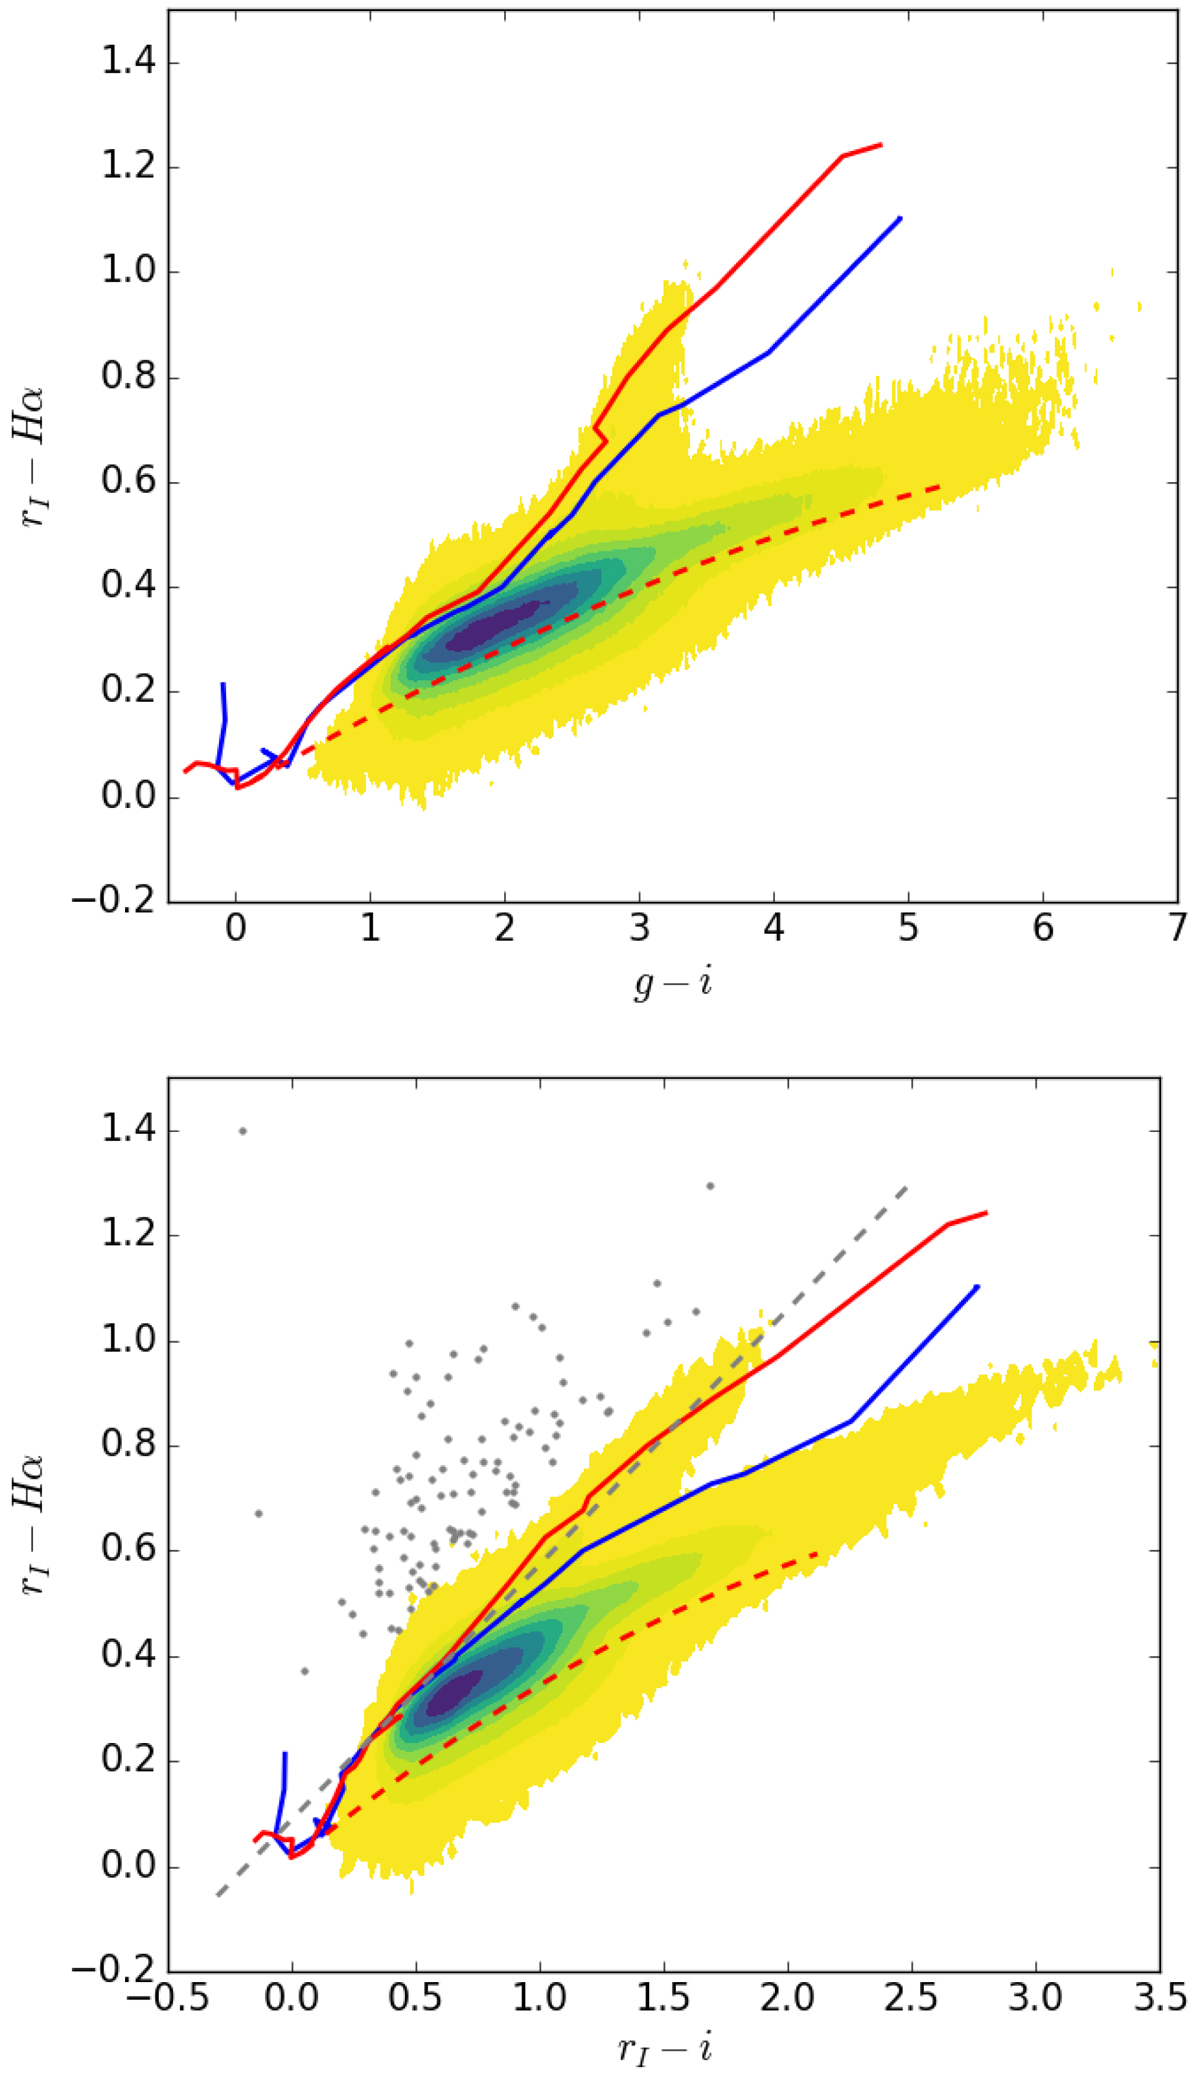
Two colour–colour diagrams involving Hα: in the top panel, rI − Hα vs. g − i and in the bottom panel, rI − Hα vs. rI − i, both shown for the Galactic longitude range, 60° < ℓ < 65°. As in Fig. 14, the density of catalogued sources is portrayed by the squared root contoured colours. Only sources with rI < 19 mag and errBits = 0 have been plotted. The solid line in red is the unreddened main sequence, while the dashed line is the reddening line for an A2V star up to AV = 10. The blue line is the sequence for the giants. The grey dashed line is the emitters selection cut appropriate to these longitudes, applied within the range −0.3 < rI − i < 2.5, while the grey dots are the selected emitters at > 5σ. The emitter selection is presented in Sect. 9.1.
Current usage metrics show cumulative count of Article Views (full-text article views including HTML views, PDF and ePub downloads, according to the available data) and Abstracts Views on Vision4Press platform.
Data correspond to usage on the plateform after 2015. The current usage metrics is available 48-96 hours after online publication and is updated daily on week days.
Initial download of the metrics may take a while.