Fig. 14.
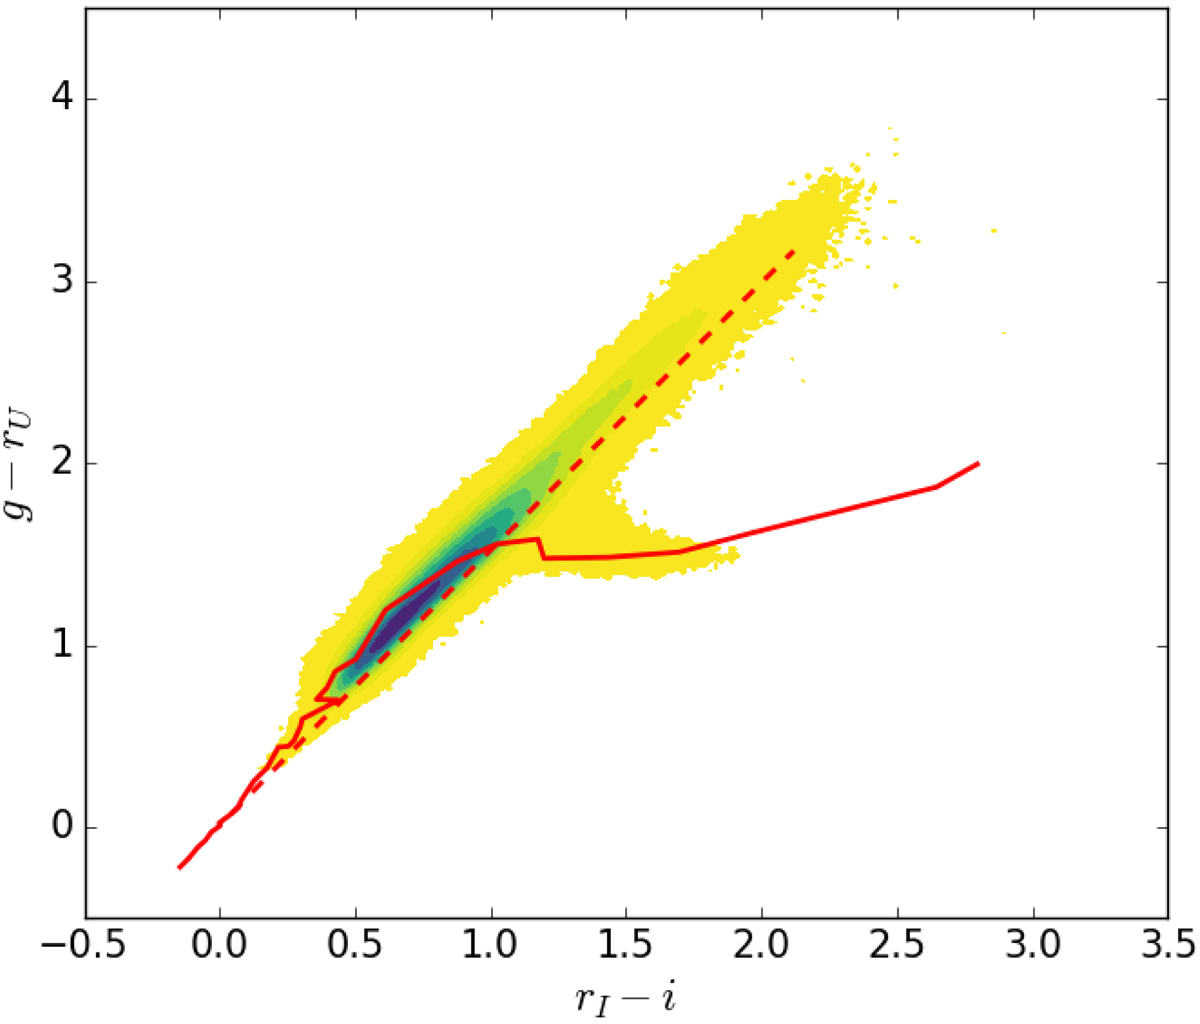
g − rU versus rI − i diagram for the Galactic longitude range, 60° < ℓ < 65°. As in Fig. 8 the density of sources is portrayed by the square root contoured colours, with yellow representing the lowest density of four sources per 0.02 × 0.02 mag2 bin. The peak density traced by the darkest colour is over 5000 per bin. Only sources with rI < 19 mag and errBits = 0 were used. The solid line in red is the unreddened main sequence, while the dashed line is the reddening line for an A2V star up to AV = 10.
Current usage metrics show cumulative count of Article Views (full-text article views including HTML views, PDF and ePub downloads, according to the available data) and Abstracts Views on Vision4Press platform.
Data correspond to usage on the plateform after 2015. The current usage metrics is available 48-96 hours after online publication and is updated daily on week days.
Initial download of the metrics may take a while.