Fig. 13.
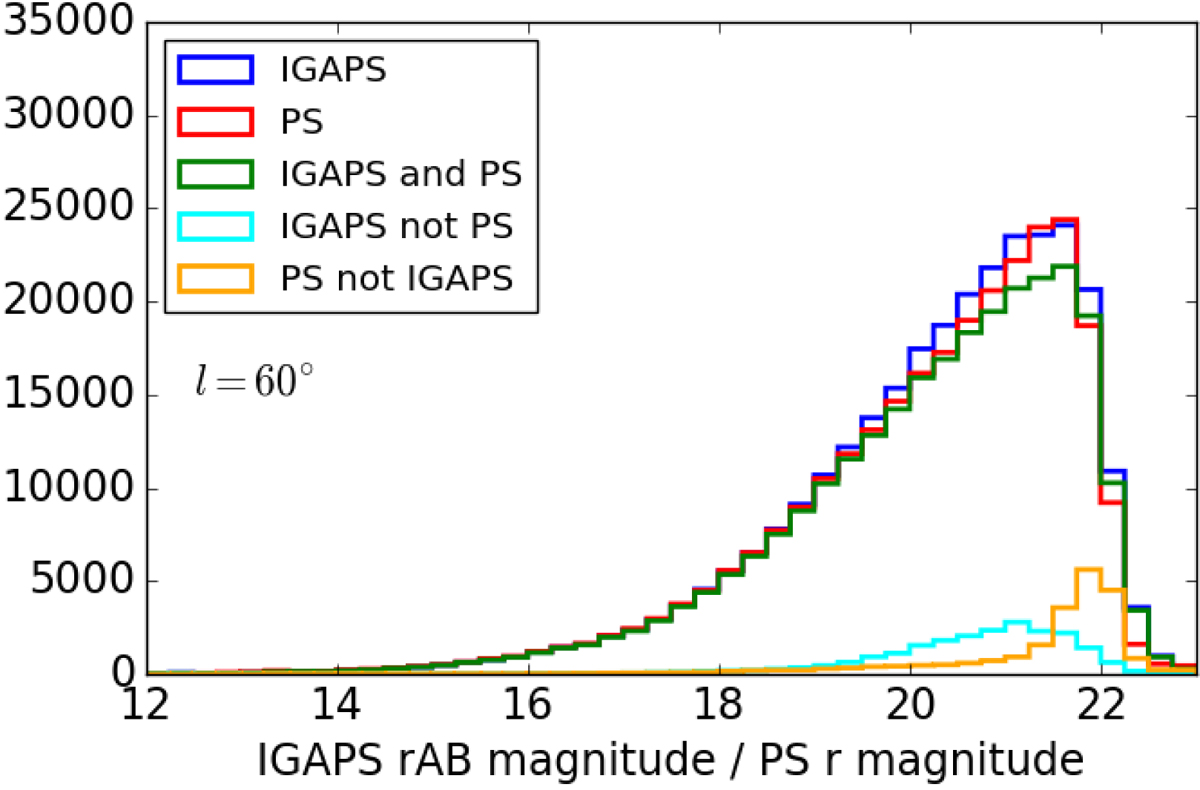
Results of the cross-match between IGAPS and Pan-STARRS at ℓ = 60°. In blue, rAB magnitude distribution for the IGAPS sources. In red, r magnitude distribution from Pan-STARRS. In green, sources with both IGAPS and Pan-STARRS values. In cyan, sources in IGAPS not crossmatched with Pan-STARRS. In orange, sources in Pan-STARRS but not in IGAPS. When two r magnitudes are available for an IGAPS source (rABI and rABU) the mean value is plotted. If only one of the two magnitudes has a value, that value is used and the object is included.
Current usage metrics show cumulative count of Article Views (full-text article views including HTML views, PDF and ePub downloads, according to the available data) and Abstracts Views on Vision4Press platform.
Data correspond to usage on the plateform after 2015. The current usage metrics is available 48-96 hours after online publication and is updated daily on week days.
Initial download of the metrics may take a while.