Free Access
Fig. 12.
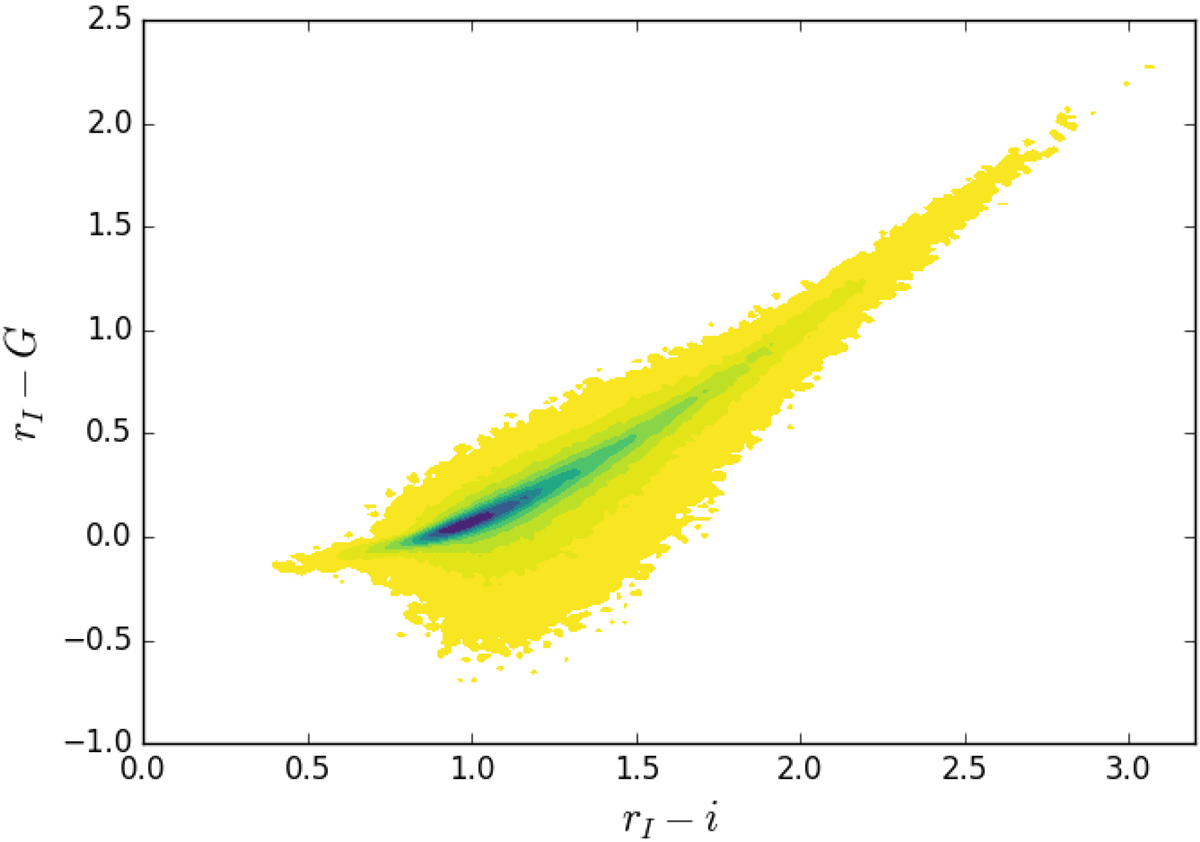
Differences between IGAPS rI and GaiaG magnitudes as a function of IGAPS rI − i colour. The colour scales according to the density of sources in each bin, with square root intervals. Yellow represents the lowest density of at least four sources per 0.02 × 0.02 mag2 bin.
Current usage metrics show cumulative count of Article Views (full-text article views including HTML views, PDF and ePub downloads, according to the available data) and Abstracts Views on Vision4Press platform.
Data correspond to usage on the plateform after 2015. The current usage metrics is available 48-96 hours after online publication and is updated daily on week days.
Initial download of the metrics may take a while.