Free Access
Fig. 11.
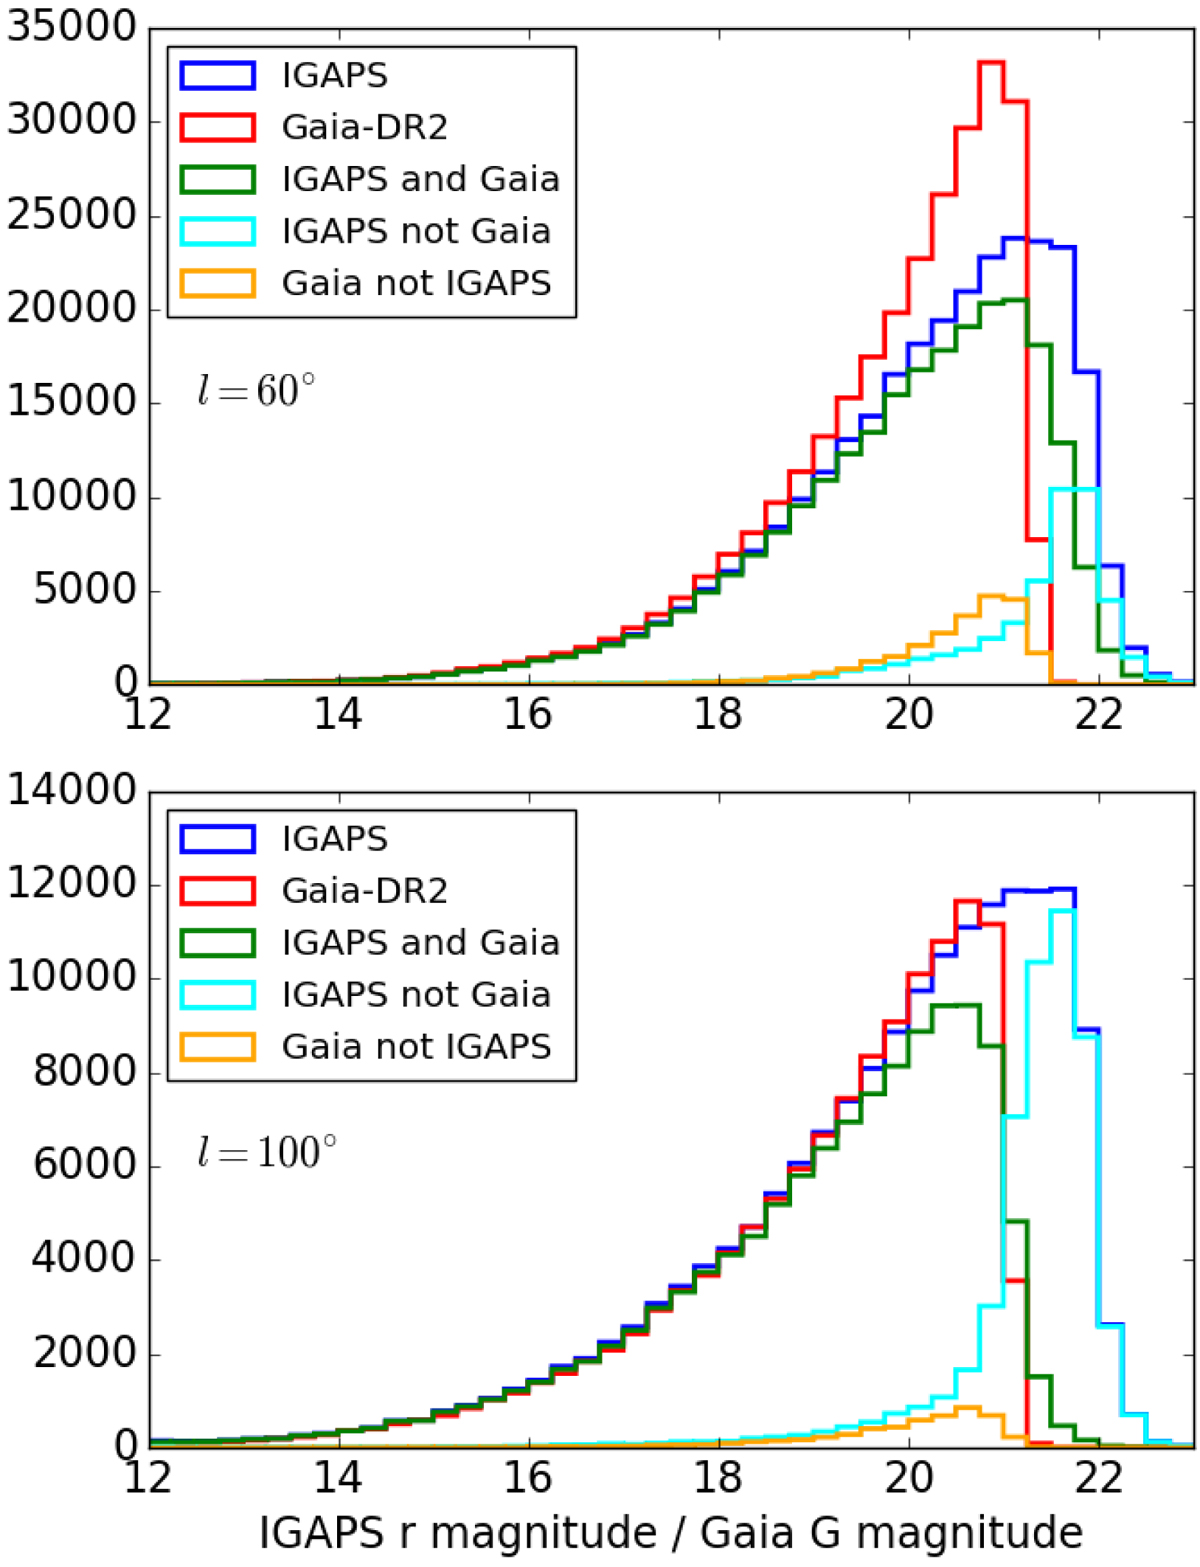
Results of the cross-match between IGAPS and Gaia DR2. Top: ℓ = 60°, bottom: ℓ = 100°. When two r magnitudes (rI and rU) are available for an IGAPS source, as is commonly the case, the mean value is plotted.
Current usage metrics show cumulative count of Article Views (full-text article views including HTML views, PDF and ePub downloads, according to the available data) and Abstracts Views on Vision4Press platform.
Data correspond to usage on the plateform after 2015. The current usage metrics is available 48-96 hours after online publication and is updated daily on week days.
Initial download of the metrics may take a while.