Fig. 7
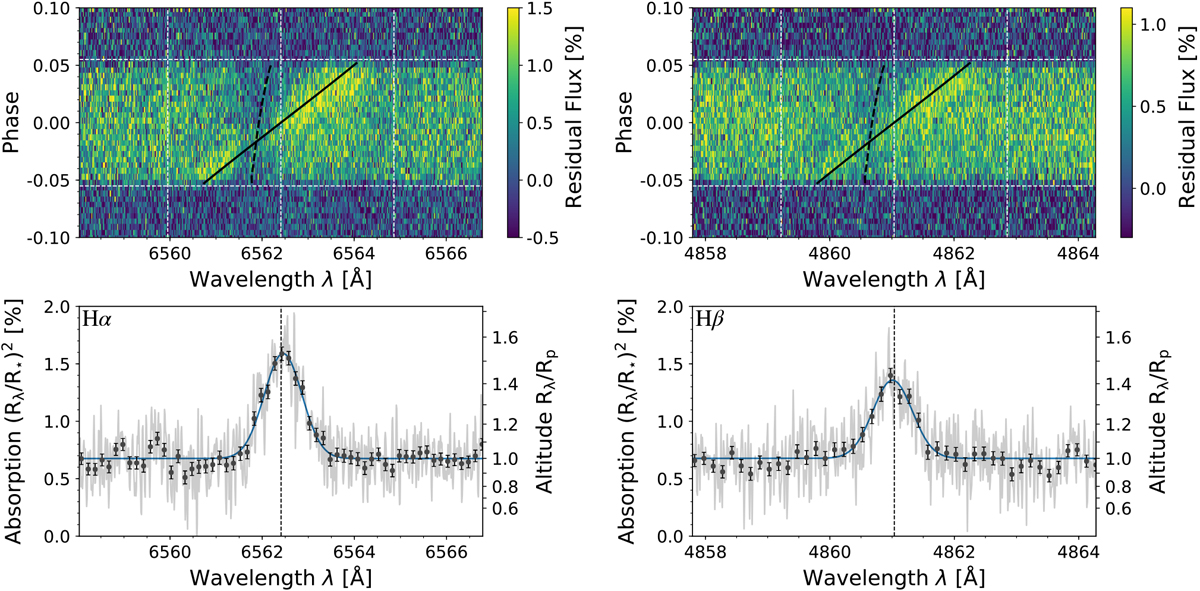
Left: detection of the planetary Hα line (significance of 24.3σ). Top left panel: map of the residual spectra ±200 km s−1 around the Hα line in the stellar rest frame (Eq. (1)). The observations of two nights are binned by 2 in phase. The planetary atmosphere Hα absorption follows the orbital velocity (solid black line). The local Hα stellar line follows the reloaded RM model (dashed black line). The first and fourth contacts are traced with the horizontal dashed white lines, the 0 km s−1 and ± v sin i* are traced with vertical dashed white lines. Bottom left panel: weighted averaged Hα transmission spectrum (corrected from the local stellar photospheric signal, Eq. (4)) in the planet rest frame (light gray), also binned by 15× in black circles (the continuum is set to the white light curve transit depth δ = 0.00677). The verticalblack dashed line shows the line center taking the systemic velocity into account. We show the Gaussian fit (blue) with contrast of 0.91 ± 0.04% and FWHM of 44.3 ± 1.8 km s−1. Right: same as for Hα, but for the Hβ line (detection significance of 16.1σ, see Table 3).
Current usage metrics show cumulative count of Article Views (full-text article views including HTML views, PDF and ePub downloads, according to the available data) and Abstracts Views on Vision4Press platform.
Data correspond to usage on the plateform after 2015. The current usage metrics is available 48-96 hours after online publication and is updated daily on week days.
Initial download of the metrics may take a while.