Fig. 6
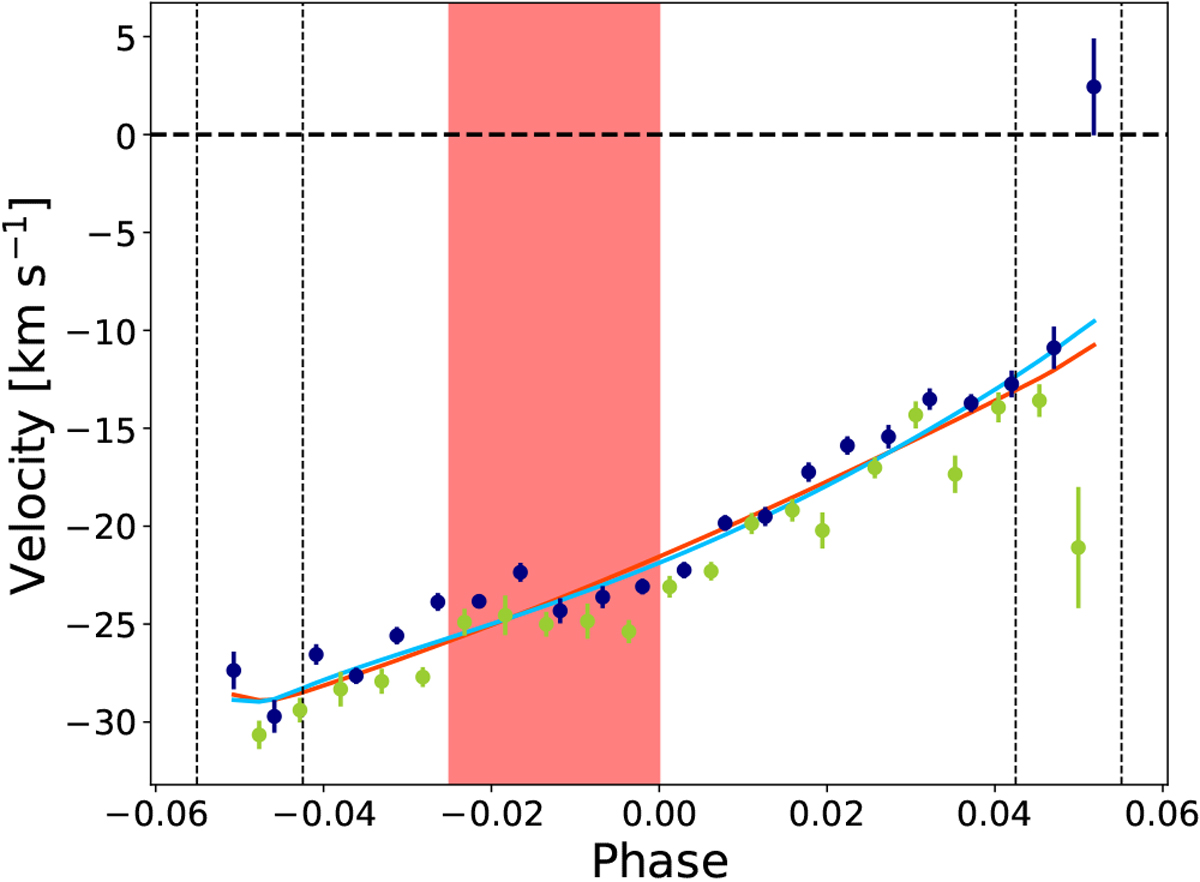
Velocities of the local stellar surface hidden behind the planet during its transit. The observations of the two nights are shown in dark blue and green, respectively. The first to fourth contacts are traced with the vertical dashed lines. The overlap region between the local stellar and atmospheric signals (between phases −0.025 and 0) is shown in red and is not used for the fit. The spin-orbit misalignment is modeled with a solid body rotation (in orange), and with a differential rotation (in light blue). The differential rotation model is slightly preferred.
Current usage metrics show cumulative count of Article Views (full-text article views including HTML views, PDF and ePub downloads, according to the available data) and Abstracts Views on Vision4Press platform.
Data correspond to usage on the plateform after 2015. The current usage metrics is available 48-96 hours after online publication and is updated daily on week days.
Initial download of the metrics may take a while.