Fig. A.2.
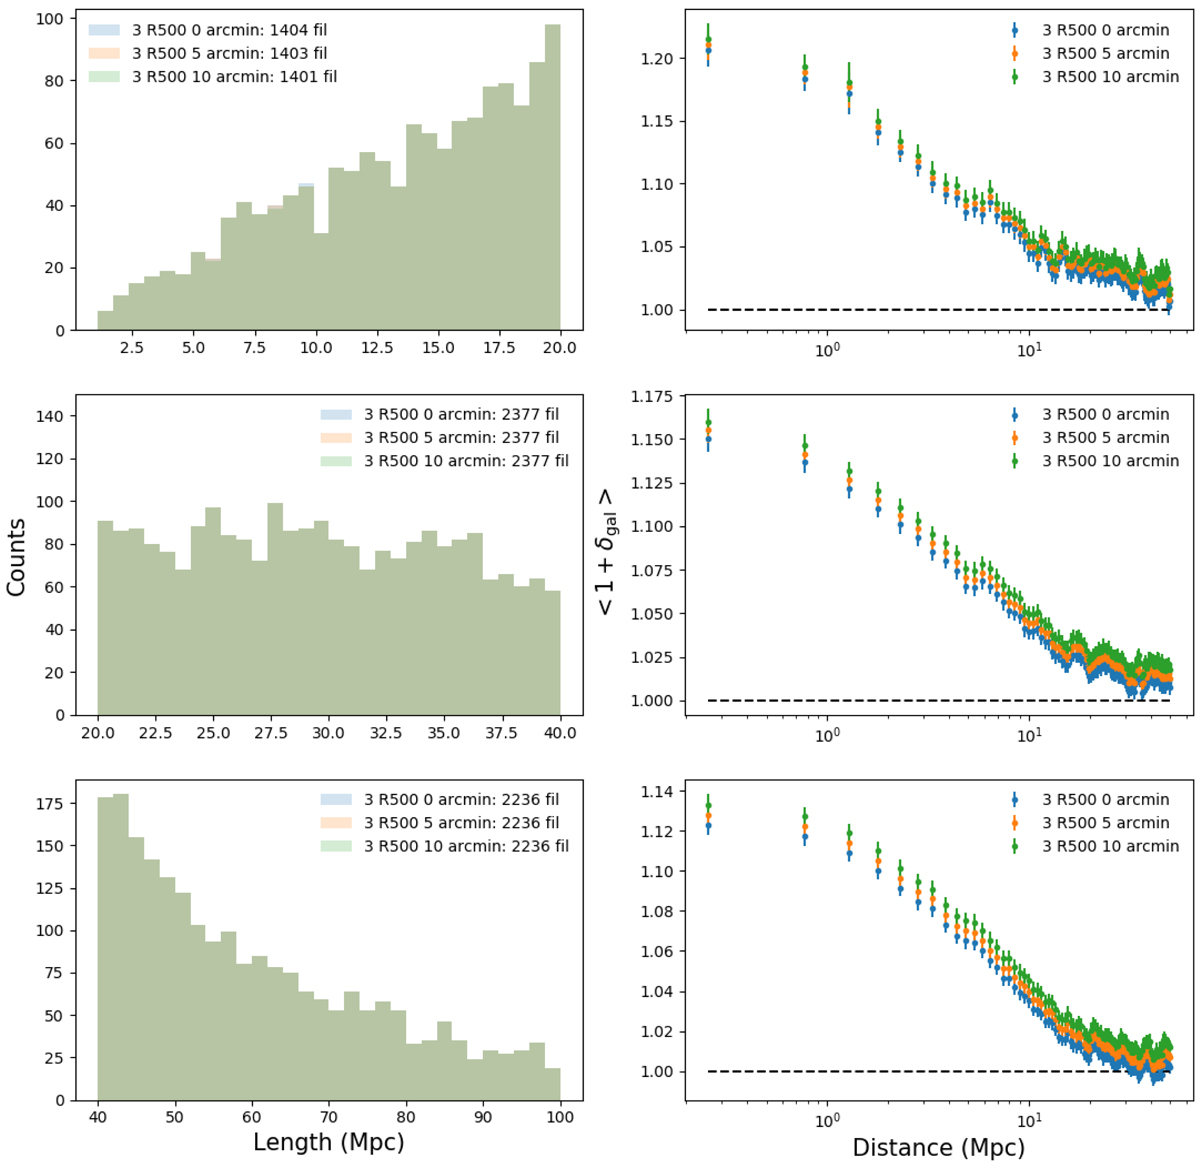
Comparison of the effect of different masks. For the galaxy clusters without estimated radius in the Planck PSZ2 catalogue with z < 0.4, regions defined by areas of 0, 5, and 10 arcmin radii are masked. No difference is noticed and all plots are overlapping. To clearly see the different profiles, we added +0.1 and +0.2 to the y-axis for the orange line and the green line, respectively. We therefore chose to mask at 5 arcmin.
Current usage metrics show cumulative count of Article Views (full-text article views including HTML views, PDF and ePub downloads, according to the available data) and Abstracts Views on Vision4Press platform.
Data correspond to usage on the plateform after 2015. The current usage metrics is available 48-96 hours after online publication and is updated daily on week days.
Initial download of the metrics may take a while.