Fig. 5.
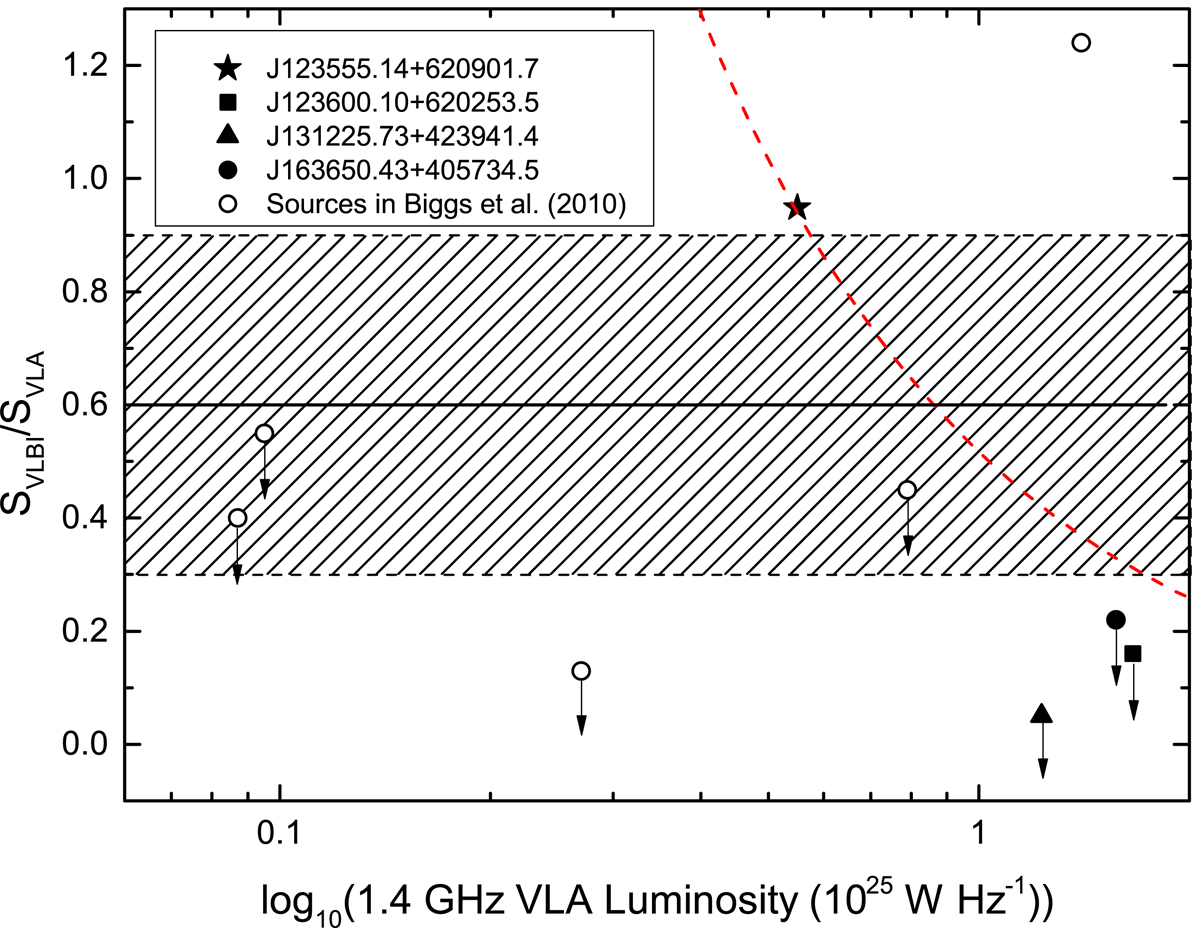
VLBI(VLBA)-to-VLA flux ratio (R) versus the 1.4 GHz VLA luminosity for the four VLBI observed sources as well as five sources in Biggs et al. (2010) with redshift information, of which one in the upper right panel was classified as an AGN. The average R value over ∼500 VLBA detected sources in Herrera Ruiz et al. (2017) of ∼0.6 is labelled by the horizontal solid line, and the 1-σ constraint of ±0.3 to the mean value is represented by the shaded area. The VLBI detected source J123555.14 has a high R value of 0.95, showing that a large fraction of its radio emission comes from a compact AGN core. For the VLBI undetected sources, the 3-σ upper limits on their R values are presented by downward arrows, which are more than −1σ away from the mean value. The red dashed curve indicates where LVLBI = 5.5 × 1024 W Hz−1 – the 1.6 GHz VLBI luminosity of the detected source J123555.14 – although J123555.14 has only medium VLA luminosity in this figure, its VLBI luminosity is higher than most of the sources.
Current usage metrics show cumulative count of Article Views (full-text article views including HTML views, PDF and ePub downloads, according to the available data) and Abstracts Views on Vision4Press platform.
Data correspond to usage on the plateform after 2015. The current usage metrics is available 48-96 hours after online publication and is updated daily on week days.
Initial download of the metrics may take a while.