Fig. 1.
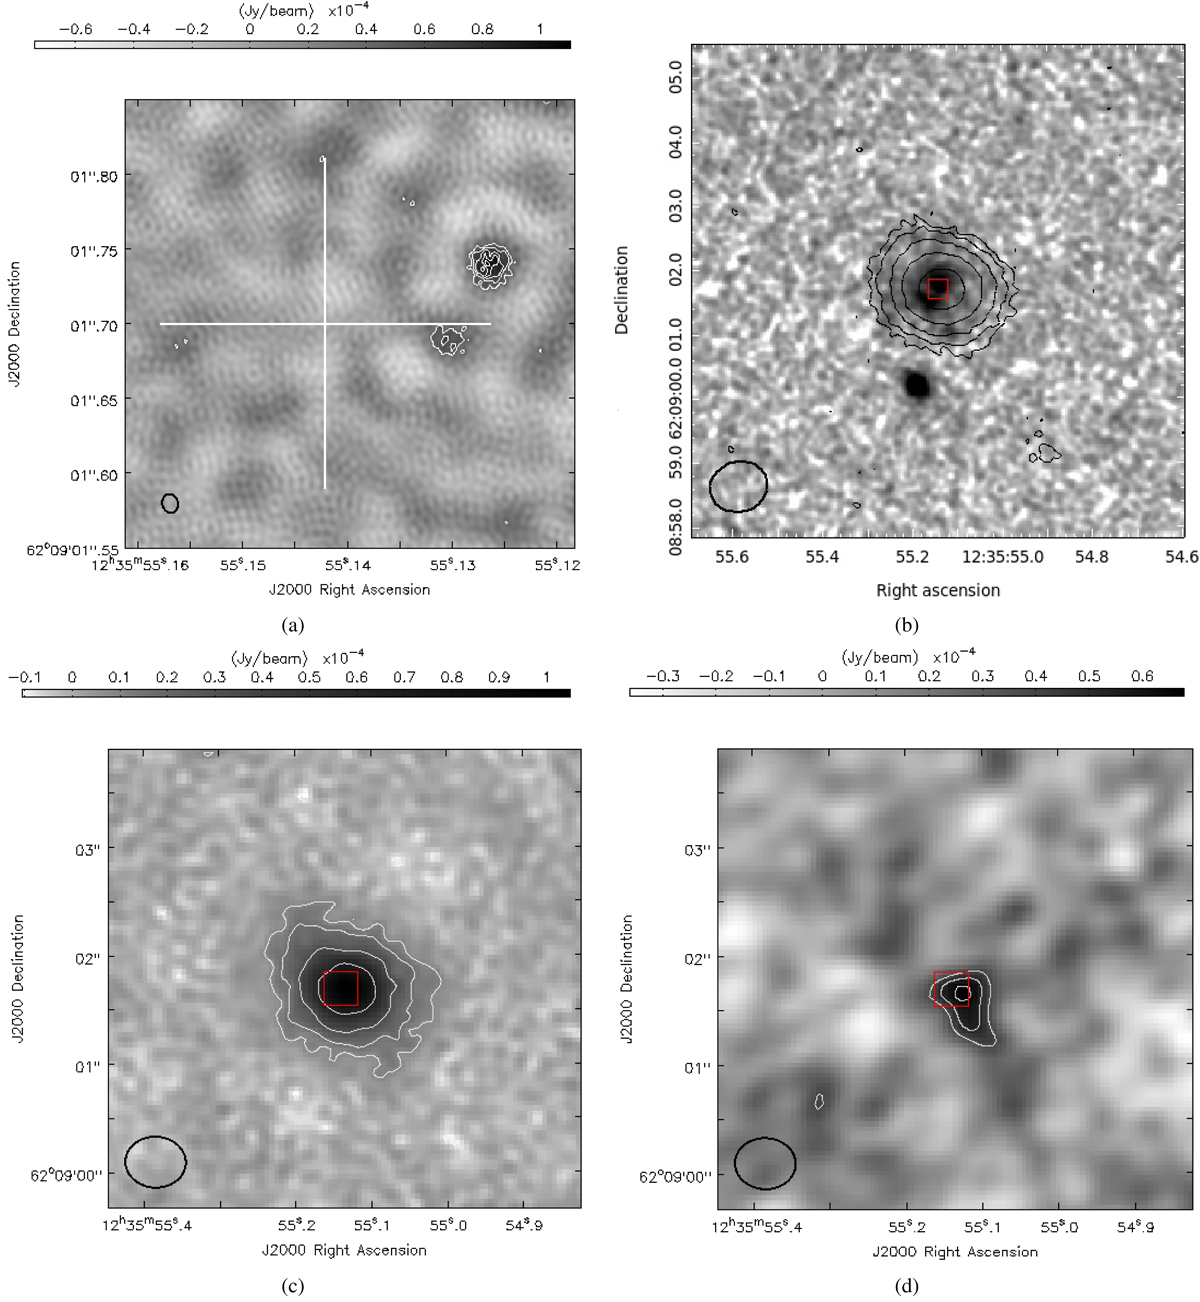
Contoured maps for the VLBI-detected source J123555.14+620901.7. a: EVN 1.6 GHz image plotted with contour levels (3, 4, 5, 6, and 7) × the rms noise level; the white cross presents the VLA coordinates measured by Richards (2000). The FoV of this image is shown by a red box in each of the other three sub-figures. b: Hubble CANDELS F814W ACS image in which the source shows a face-on disc-like morphology with a close companion for clarity; the image was smoothed with a 2D Gaussian convolution with FWHP of ∼0.1″. The overlaid contour was plotted at 3, 6, 12, 24, and 48 × the rms noise of the eMERGE-JVLA maximum sensitivity image at 1.5 GHz. c: eMERGE re-weighted 1.5 GHz map presented with contour levels 3, 6, 12, and 24 × the rms noise level. d: eMERGE 5.5 GHz map plotted with contour levels (3, 4, and 5) × the rms noise level. The detected compact AGN core is clearly shown in the images. In each panel, the beam pattern of the contours is illustrated with a black ellipse.
Current usage metrics show cumulative count of Article Views (full-text article views including HTML views, PDF and ePub downloads, according to the available data) and Abstracts Views on Vision4Press platform.
Data correspond to usage on the plateform after 2015. The current usage metrics is available 48-96 hours after online publication and is updated daily on week days.
Initial download of the metrics may take a while.