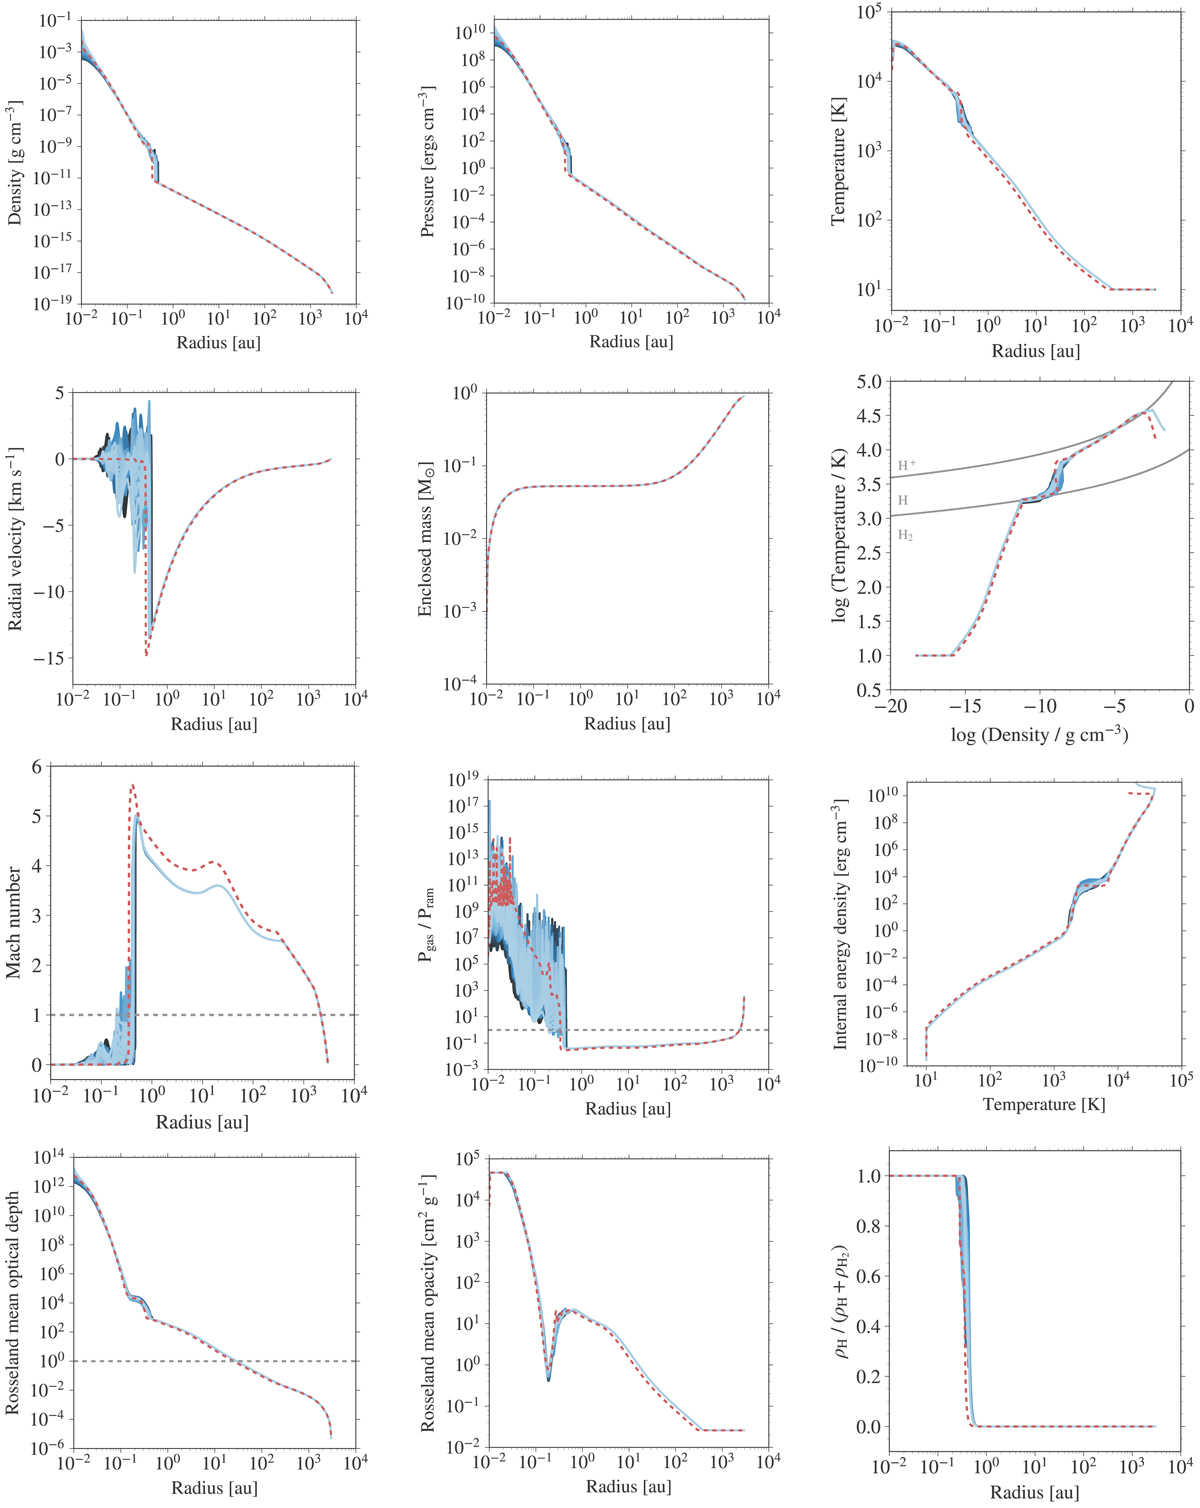
Fig. 6.
Download original image
Radial profiles (across and down) at 312 years after formation of the second core, formed due to the collapse of a 1 M⊙ cloud core with an outer radius of 3000 au and an initial temperature of 10 K. The different subplots show the radial profiles (across and down) of (a) density, (b) pressure, (c) gas temperature, (d) radial velocity, and (e) enclosed mass as well as the (f) thermal structure, (g) Mach number, (h) ratio of gas to ram pressure Pram = ρu2, (i) internal energy density as a function of temperature, (j) optical depth, (k) Rosseland mean opacity, and (l) dissociation fraction. The colour gradient from light to dark blue spans the polar angle from the midplane (θ = 90°) to the pole (θ = 0°). The grey lines in the thermal structure plot show the 50% dissociation and ionisation curves. The radial profiles from the 1D collapse simulation for the same initial conditions and resolution are over-plotted as a dashed red line in all the subplots.
Current usage metrics show cumulative count of Article Views (full-text article views including HTML views, PDF and ePub downloads, according to the available data) and Abstracts Views on Vision4Press platform.
Data correspond to usage on the plateform after 2015. The current usage metrics is available 48-96 hours after online publication and is updated daily on week days.
Initial download of the metrics may take a while.