Fig. 2.
Download original image
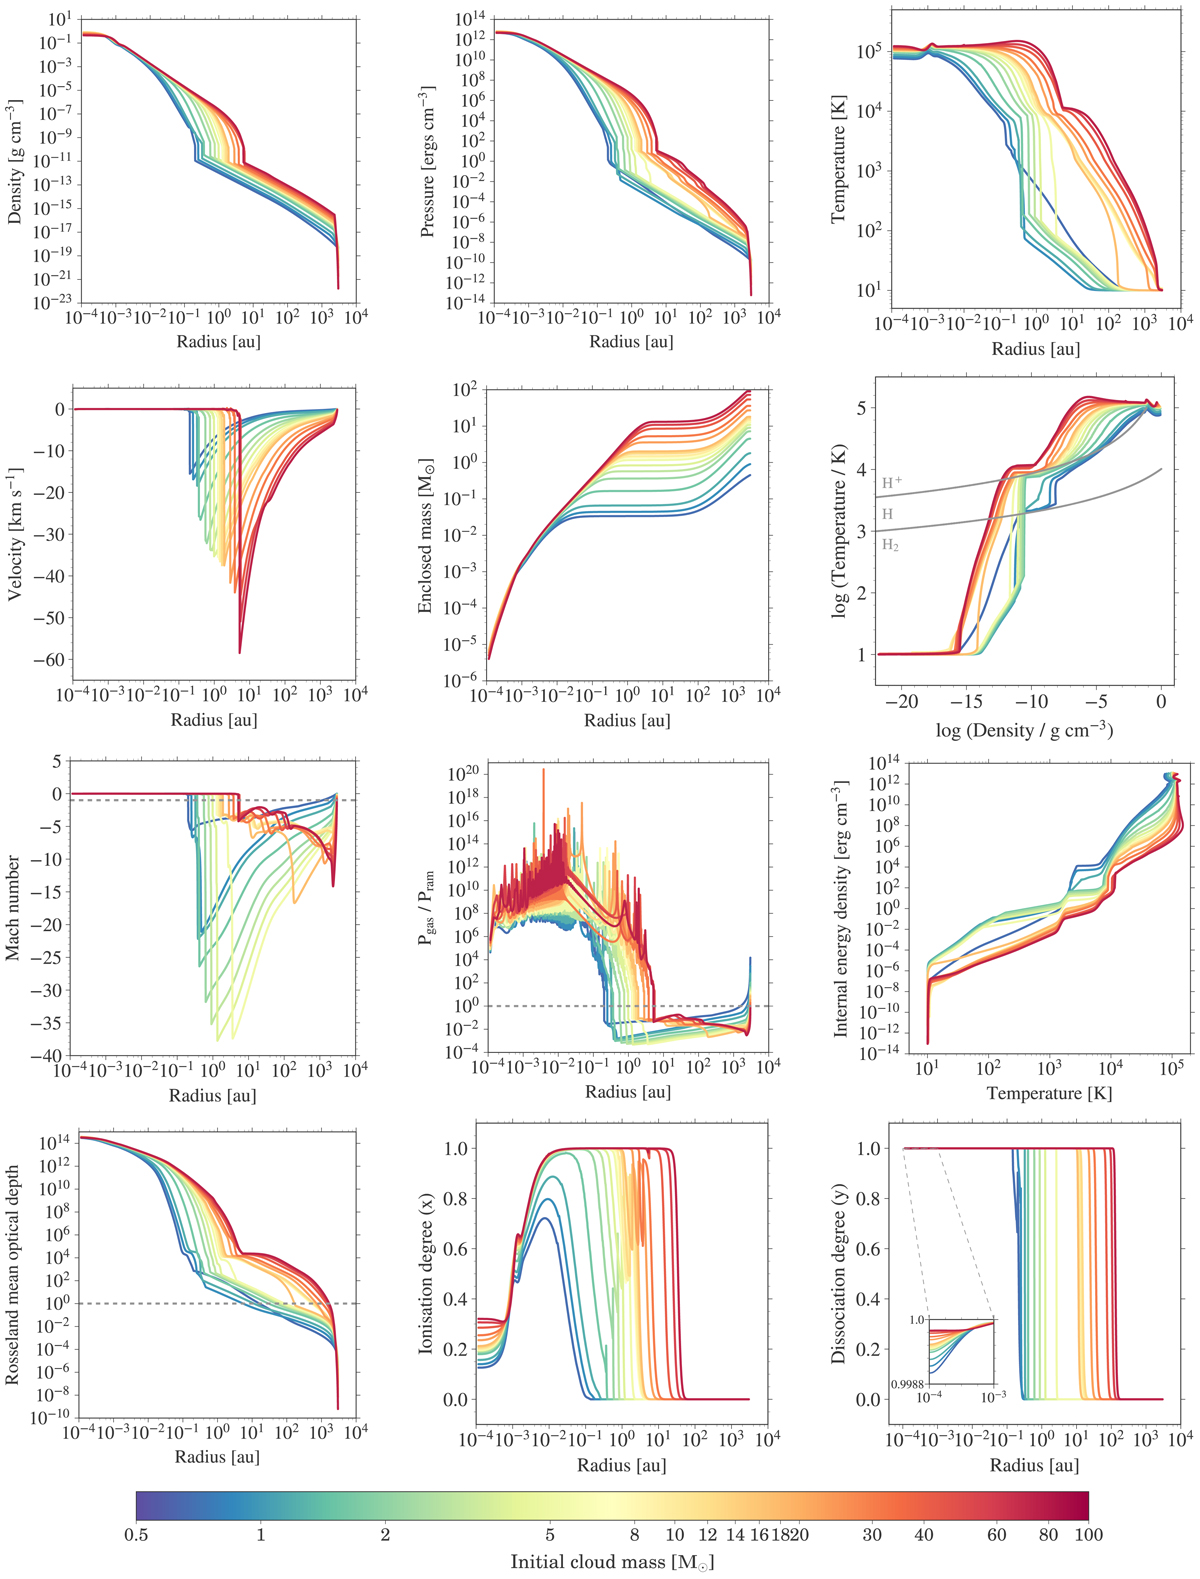
Radial profiles (across and down) of (a) density, (b) pressure, (c) gas temperature (=radiation temperature), (d) velocity, and (e) enclosed mass as well as the (f) thermal structure, (g) Mach number, (h) ratio of gas to ram pressure Pram = ρu2, (i) internal energy density as a function of temperature, (j) optical depth, (k) degree of ionisation (Bhandare et al. 2018, Eq. (16)), and (l) degree of dissociation (Bhandare et al. 2018, Eq. (17)) for all the cases at the final simulation snapshot (final times for different cases indicated in Table 2) in our simulations when the central density is roughly 0.5−0.8 g cm−3. Different colours indicate cloud cores with different initial masses as seen in the colour bar. Grey lines in the thermal structure plot show the 50% dissociation and ionisation curves.
Current usage metrics show cumulative count of Article Views (full-text article views including HTML views, PDF and ePub downloads, according to the available data) and Abstracts Views on Vision4Press platform.
Data correspond to usage on the plateform after 2015. The current usage metrics is available 48-96 hours after online publication and is updated daily on week days.
Initial download of the metrics may take a while.