Open Access
Fig. A.1.
Download original image
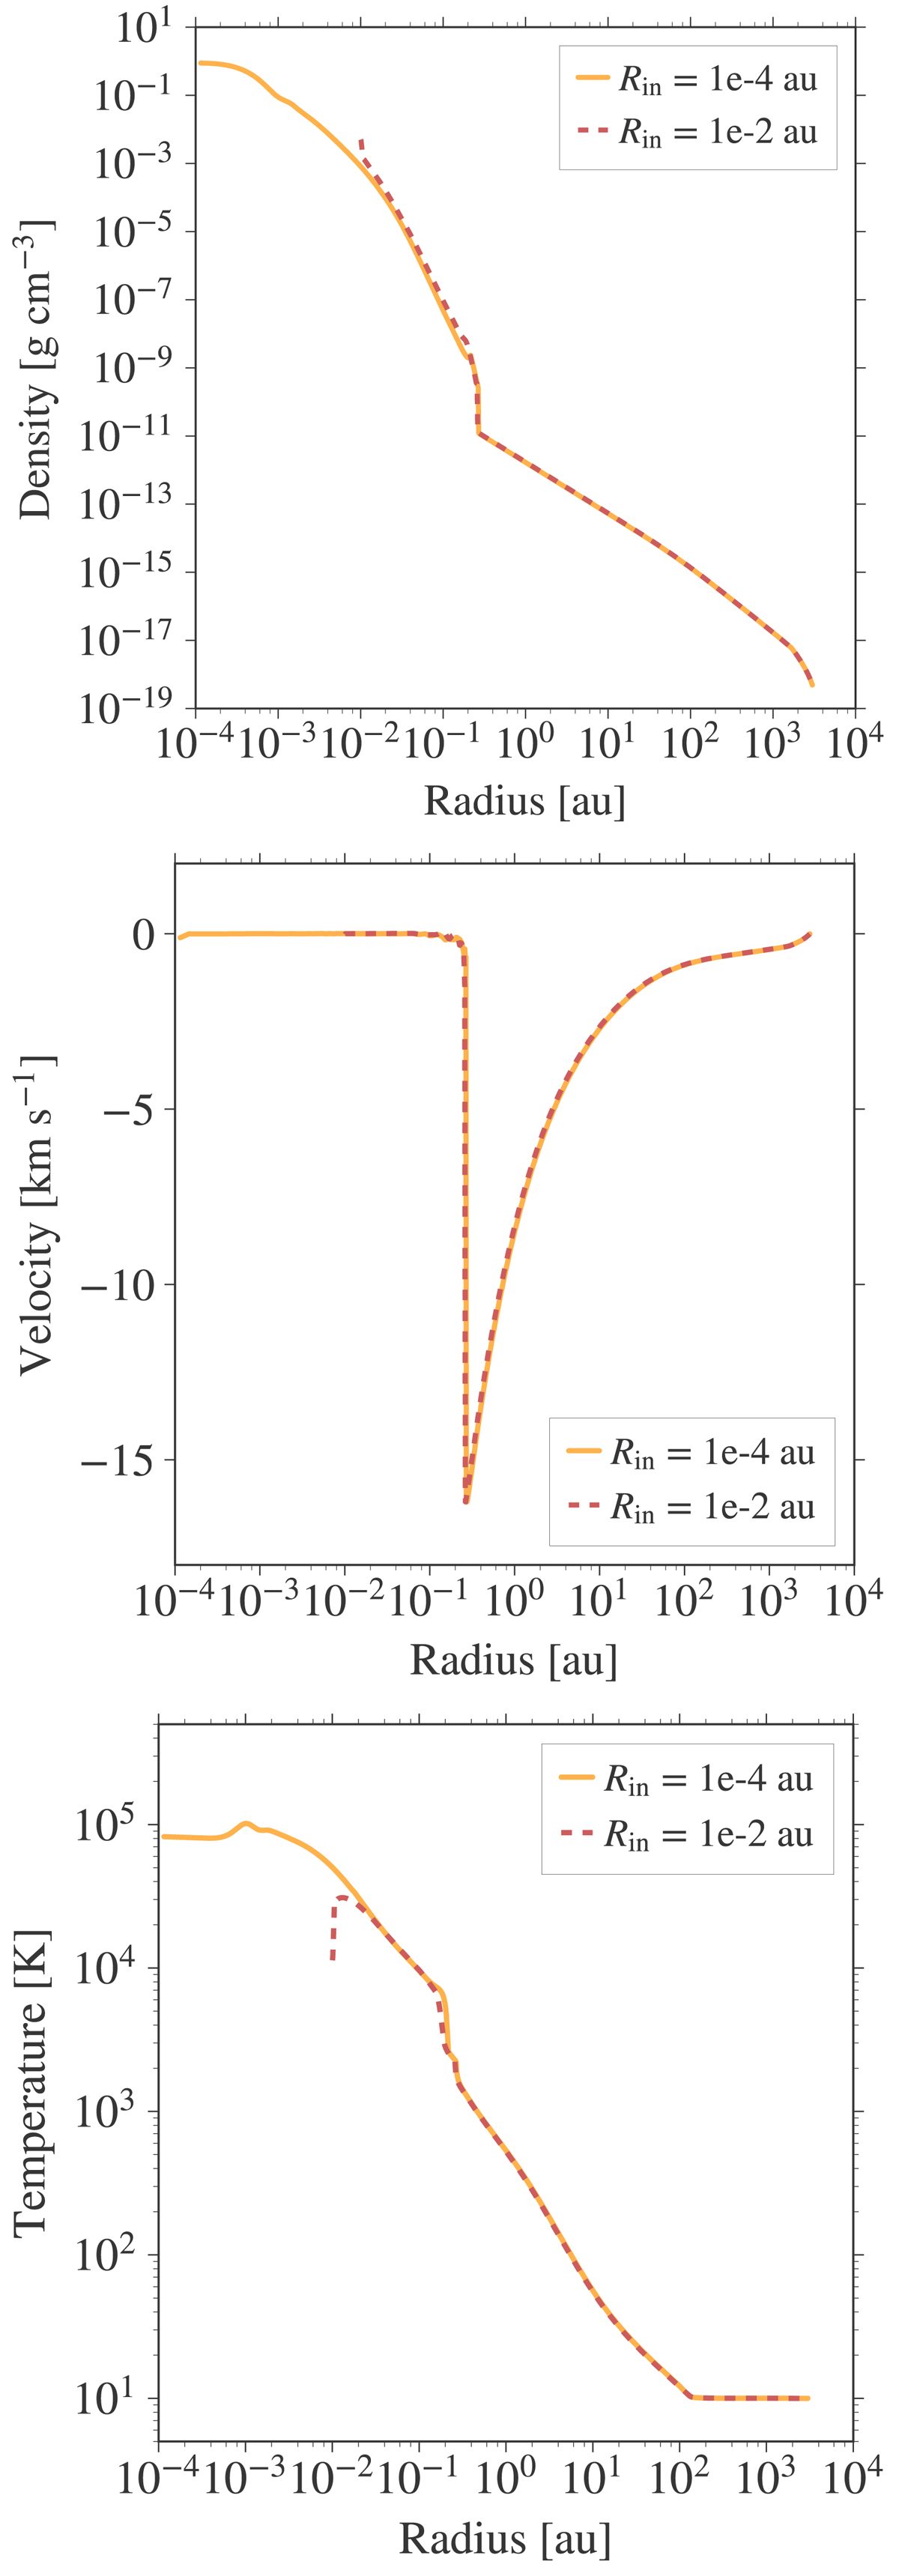
Radial profiles of the density (top), velocity (middle), and gas temperature (bottom) for an initial 1 M⊙ collapsing cloud core from the 1D simulations are shown at a time step after the second core formation. The yellow line indicates an inner radius of 10−4 au and the dashed red line indicates an inner radius of 10−2 au.
Current usage metrics show cumulative count of Article Views (full-text article views including HTML views, PDF and ePub downloads, according to the available data) and Abstracts Views on Vision4Press platform.
Data correspond to usage on the plateform after 2015. The current usage metrics is available 48-96 hours after online publication and is updated daily on week days.
Initial download of the metrics may take a while.