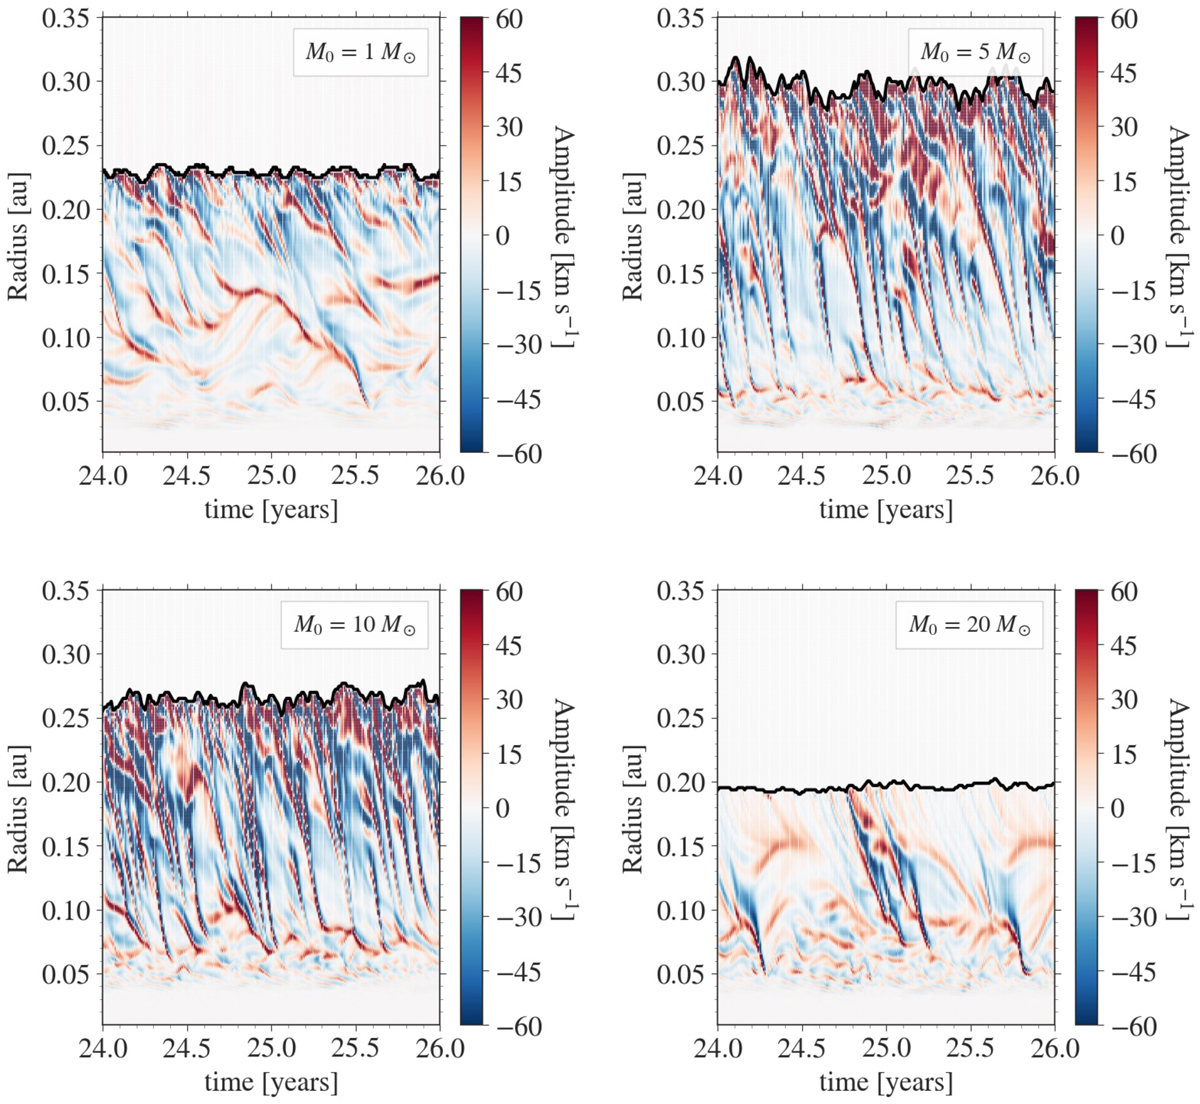
Fig. 14.
Download original image
Time evolution of the amplitude of the dominant spherical harmonics mode of the quantity A(t, r, θ) from Eq. (8). The second core radius is shown by the black line. The time t = 0 indicates the onset of the second core formation for the different collapse scenarios. Shown here is a small interval in time for the 1 M⊙ (top left), 5 M⊙ (top right), 10 M⊙ (bottom left), and 20 M⊙ (bottom right) cases.
Current usage metrics show cumulative count of Article Views (full-text article views including HTML views, PDF and ePub downloads, according to the available data) and Abstracts Views on Vision4Press platform.
Data correspond to usage on the plateform after 2015. The current usage metrics is available 48-96 hours after online publication and is updated daily on week days.
Initial download of the metrics may take a while.